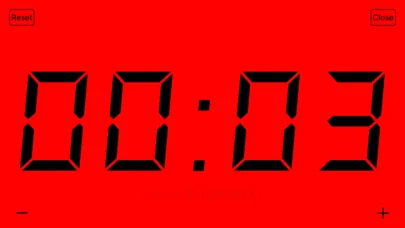
29K iOS Apps Tracked Updated 1 min ago Revenue Forecasts
Create Account Sign In
Home

Presentation Clock

63
Quality Score
Solid

Presentation Clock

Low confidence
4.3 ✍️ Editor
✍️ bumetric analysis

Presentation Clock is an iOS app from Shawn Welch in the Utilities category, currently rated 4.3★ across 95 ratings. Initial signal reads as mixed reviews: supporters praise core features while critics cite stability and value gaps.

Quality Score is 63: Solid (established niche player). For a Utilities app, that means established niche player. The full BU Investment Matrix below scores 8 dimensions including monetisation, growth, and operational risk.

Track changes month-over-month in the Performance section below: live snapshot history and revenue forecast included.

💰 Monthly revenue · now vs forecast
● Right now
$3.6K
per month
12-mo forecast
$3.2K – $11.4K
per month
24-mo forecast
$2.9K – $26.3K
per month
INDIE tierFREE
💡 Grow this revenue
Free AI audit of this app’s store listing
  • Title & subtitle keyword fit
  • Description hook & conversion structure
  • Screenshots, ratings, reviews strategy
Run free AI audit →
Typical impact: +2-5× organic installs
🔔Notify me when this app's revenue changes by

📊 Performance Tracking LIVE

Loading…
idle
0%
Rating
Reviews
Forecast Revenue / mo
Snapshots tracked
0
since first record
ONE-TIME · BUILD 💰 Estimated build cost
$45K
What it cost to build · not monthly revenue
Likely range $35K – $60K
$25K · MVP floor $100K · indie scale $500K+ · studio build
📈 Pays back in ~2 months at current MRR

Synthetic estimate. Inputs: category complexity, file size, screen count, monetization layer, platform reach, age × team-size proxy. Calibrated against 2024-2026 indie-agency rate surveys. Full math + source list on /methodology.

Where the money goes
🧱 MVP baseline (design + 1-store ship) +$28K
📱 5 unique screens × $4.5K +$22K
Utilities complexity ×0.85 $-7575
Total estimate $45K
ONE-TIME · EXIT VALUE 💵 Estimated acquisition value
$325K
What it would sell for · not monthly revenue
Marketplace range $250K – $425K · 12× MRR multiple
💸 ~7.2× return on build cost

Synthetic estimate. Multiple band derived from ad-supported + age, rating quality, category demand, and user-base maturity. Calibrated against 2024-2026 indie-app-marketplace closed-deal medians. Full math + comparable deal list on /methodology.

How the multiple was built
📺 Ad-supported base 15× MRR
🏷 Utilities category multiple -10%
Small user base (<1K ratings) -8%
Final multiple 12× MRR
🔬

How we forecast this revenue

MEDIUM CONFIDENCE
Baseline
$3.6K/mo · ML-estimated from 234 triggers
Growth rate
+6.0% MoM · INDIE tier baseline (compound monthly)
Direction
Headwinds: rating drift may slow acquisition
6 months
$3.1K – $7.2K
12 months
$3.2K – $11.4K
24 months
$2.9K – $26.3K
Compound growth at +6.0% MoM (tier baseline for INDIE). Range widens with horizon — typical noise band ±40% at 6mo.. Ranges widen with horizon — distant futures carry more uncertainty.
📊

BU Investment Matrix

Pre-traction · 29/100INDIE TIERFREE (NO MONETIZATION)limited signal
GrowthFounderQualityRevenueMonetiz.MoatMarketSafety
Growth Velocity
5.0
Founder Strength
5.4
Product Quality
1.9
Revenue Strength
3.6
Monetization Maturity
0.5
Defensibility
4.5
Market Position
2.0
Operational Safety
0.0
  • 💰 Revenue: Modest — $1K - $9K/mo · INDIE tier · medium confidence, trajectory unclear.
  • ⭐ Quality: 4.28★ across 95 reviews — weak — significant quality concerns.
  • 📍 Market: Not yet charting in any of the 9 monitored markets.
  • 📈 Growth: ⚠ last update 3541d ago — possibly dormant.
  • ⚠️ Risk: High — 3.6% refund mentions, bug mentions above category norm, rating drift -0.66 ★ (recent 50 vs lifetime).
🎯 For competitors: Vulnerable. Quality drift + slow updates create a clear opening for a fresh competitor with active dev cadence.
💵 For acquirers: Estimated asking range 12-22× monthly = $43K-$79K. Portfolio play ($27K/mo combined) commands premium. Discount applied for operational risk..
Composite of 8 dimensions computed deterministically from public signals — no LLM, every score traces back to a measurable input. Default weights shown; "compete" / "acquire" / "invest" lenses re-weight without re-fetching.
Range:

💰 Forecast Revenue / mo

MODEL
Revenue forecast computed from BU's 234 trigger model on each snapshot. Calibrated against ground-truth from 58 verified-revenue apps.
🔬Forecast Breakdown — Why This Estimate?Top 8 of 8 triggers
Our ML model uses 200+ signals from public data. These are the most influential for this app:
Paid app ($0.00)METRIC
+$2,800
5 starREVIEW
+$1,800
excellent appREVIEW
+$1,500
Mature app (15y old)METRIC
+$1,500
highly recommendREVIEW
+$1,400
Good rating (4.3★)METRIC
+$800
Single-language (English only)METRIC
−$400
Pre-traction phase (95 ratings)METRIC
−$300
METRIC = structural app data · REVIEW = mined from user reviews · ✓ VERIFIED = Stripe-verified anchor (TrustMRR)

📈 Reviews Growth

LIVE
Cumulative review count from first BU snapshot. Each point = a tracked update.

⭐ Rating Trend

LIVE
Average rating evolution. Updates with each new review batch.

🆕 What's New · v2.0.1

+ Minor Bug Fixes

Profile & Insights

Everything we know — and don't — about this app and its company.

Identification

App name
Presentation Clock
Developer
Shawn Welch
Bundle ID
com.anythingsimple.countdown
App Store URL
Open in App Store
Category
Utilities
Content rating
4+
Languages
EN

Company

Website
Not found
Tagline
Not found
Description
Not found
Founded
Not found
HQ / Address
Not found
Employees
Not found
Logo
Not found

Revenue

Verified revenue / mo
Not found
AI revenue estimate / mo
Not found
AI annual estimate
Not found
ML model estimate / mo
$27.1K/mo
Top-grossing rank
Outside top 100 in US Utilities
All-time revenue
Not found
Pricing
Not found

Founder

Founder data not yet collected for this app.

Funding

Funding data not yet collected for this app.

Press & Links

Press & Links data not yet collected for this app.

Contacts & Socials

Contacts & Socials data not yet collected for this app.
📈Ratings growth95 ratings+150% lifetimeShow 3-year history estimate ▾
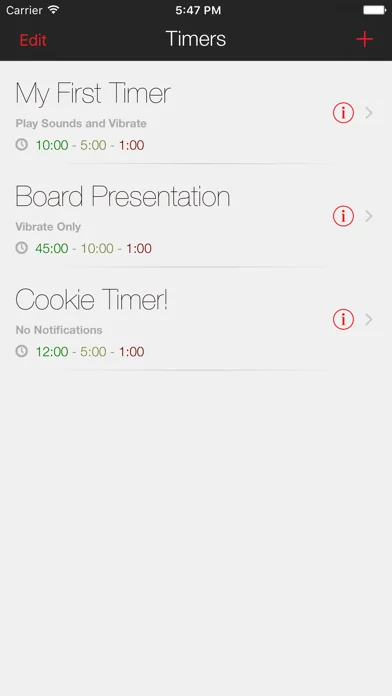
Dec 2014Sep 2019Jun 2026
Tracked (58 weeks) Pre-tracking estimate (37 weeks) · model-based, ±5% noise · anchored to release date and current value
🌍Geographic ReachNot ranked
This app is currently outside the top 100 grossing in all 9 countries we monitor (US, UK, DE, FR, JP, CA, AU, BR, IN). Niche or new apps often launch this way — popularity rankings appear once daily revenue clears the regional threshold.
💰Pricing History$0.00 → $0.99 (+0%)
Profile is built from iTunes Lookup + developer site scrape + ML revenue model. Empty fields show "Not found" — additional sources (Crunchbase, X, IndieHackers, Acquire.com) coming.

📝 About this app

This app does one thing but it does it extremely well. If you give presentations, training, tutorials, or speak publicly, this app is for you. Beautifully animated, with large, easy to read numbers that change colors at thresholds you determine. When the timer hits 0:00, the colors invert (black on red) and continue counting up indicating how long you've gone over. Fully customizable options and simple touch controls

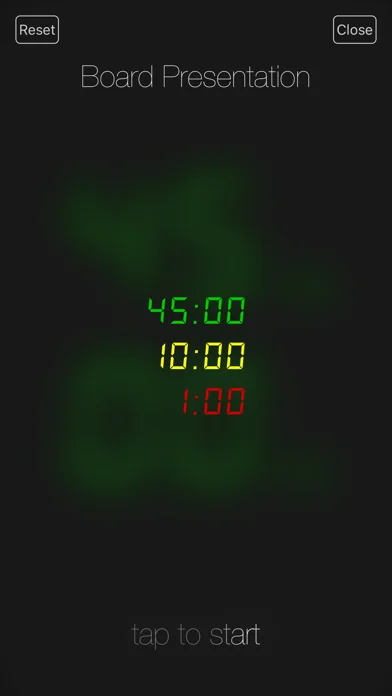
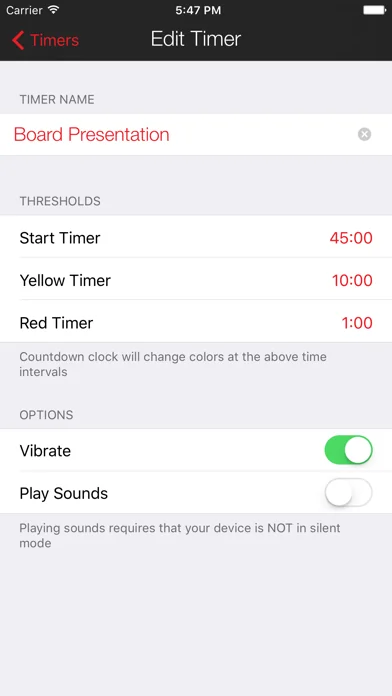
* Create and save as many timers as you want
* Set time limits for color warnings to change the clock to green, yellow and red… View full description on the official store →
App Specs
🔐 Own this app? Claim & verify MRR →
💾 1 MB🔞 4+📱 iOS 8.0+🔖 v2.0.1🔄 updated 0d ago🌐 EN📂 Utilities💰 Paid
📅

What Worked™ · Development Pipeline

6 EVENTS TRACKED
Detected changes in this app over its tracked lifetime — each event links cause (what changed) to effect (what moved). Sorted newest first.See full history →Version history →
2026-05
Rating ↓ 4.80 → 4.28 (dropped 0.52★)
2026-05
💲
Went paid — introduced $0.99 price point
2026-03
Rating ↑ 3.58 → 4.80 (improved 1.22★)
2015-11
📈
Crossed 50 ratings — social-proof flywheel kicking in
2011-07
📈
Crossed 10 ratings — social-proof flywheel kicking in
2010-09
🚀
First tracked snapshot — initial data captured
🗣

Voice of Customer

Based on 56 reviews across 2 markets
● 77% positive  ·  ● 2% neutral  ·  ● 21% negative  ·  Rating drift: -0.66★ (declining — recent 50: 3.62★ vs lifetime: 4.28★)
−10+12016-Q32016-Q42018-Q1
VADER compound sentiment per quarter (−1 = fully negative, +1 = fully positive). Each point ≥ 5 reviews.
Sentiment by country (−1 to +1)
🇦🇺 AU
+0.71
🇺🇸 US
+0.43
Top praise themes
timer ×21 simple ×10 easy ×9 update ×8 set ×7 now ×7 exactly ×7 it's ×6
Top complaint themes
doesn't work ×3 now ×11 screen ×7 timer ×5 numbers ×5 update ×4 tap ×4 apple ×4
Risk signals
Refund mentions: 3.6% Bug mentions: 5%
🌍

Multi-Country Performance

Available in 7 of 9 monitored markets
MarketRatingReviewsCurrent version
🇦🇺 AU4.25★44.25★ this version
🇧🇷 BR5★15★ this version
🇨🇦 CA4★74★ this version
🇬🇧 GB4.75★164.75★ this version
🇮🇳 IN0★0
🇯🇵 JP4★14★ this version
🇺🇸 US4.28421★954.28421★ this version
🔔

Track this app’s revenue

FREE
Get an email when revenue moves by your threshold. No spam, unsubscribe in one click.

📝 Description

95
BU Score · Transcendent

Similar apps in Utilities

About this analysis
ZCAnalyzed by Zakhar Chumak · founder, bumetric·Full methodology·Low confidence

Why low confidence: only 95 ratings · no founder-verified revenue (model estimate only) · revenue figure is directional only.

Frequently Asked Questions

4 answers · auto-generated from this app's public data
How much does Presentation Clock make per month?
Based on our ML-calibrated revenue forecast, Presentation Clock earns approximately $27K/mo. This is a US-storefront-equivalent estimate; global revenue can be several times larger for internationally-distributed apps. See the methodology page for the full formula and confidence bands.
What apps are like Presentation Clock?
Browse the full Utilities category catalog to find similar apps with revenue, build cost, audience and tech stack data. Each /p/{slug} page also shows a Compare side-by-side widget with three peer apps from the same niche.
Who makes Presentation Clock?
Presentation Clock is published by Shawn Welch on the Apple App Store. See the full publisher portfolio (other apps by the same developer) via the More by developer block on the product page above.
What is Presentation Clock's BU Score?
Presentation Clock has a BU Score of 63/100 (Solid). The score combines App Store rating, ratings count, monetization model and revenue signals calibrated against founder-verified MRR anchors. See the BU Score formula.