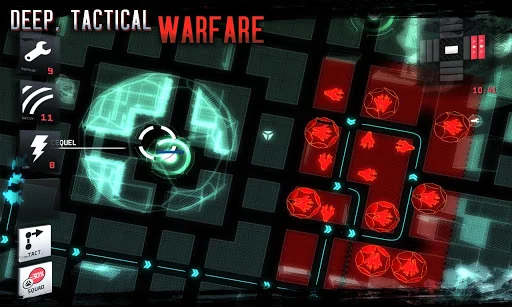
All About Tower Offense vs. Tower Defense
Anomaly 2 is a sequel to the critically acclaimed Anomaly Warzone Earth. Maintaining the core elements of the original, Anomaly 2 adds new features to the single-player campaign and finally puts your skills to a test in a completely unique experience: the dynamic tower defense vs. tower offense multiplayer mode!
In the years following the invasion of Earth in 2018, the planet is overrun by alien machines. Humankind is on the verge of extinction. B…
Anomaly 2 is a sequel to the critically acclaimed Anomaly Warzone Earth. Maintaining the core elements of the original, Anomaly 2 adds new features to the single-player campaign and finally puts your skills to a test in a completely unique experience: the dynamic tower defense vs. tower offense multiplayer mode!
In the years following the invasion of Earth in 2018, the planet is overrun by alien machines. Humankind is on the verge of extinction. Banded together in huge convoys, they search the frozen tundra for food and supplies. Since the war, the roles have been reversed: now our species seems to be the Anomaly on a machine-controlled planet. Your convoy, Commander, is called Yukon.
Anomaly 2 takes the RTS tower-offense concept from Anomaly Warzone Earth to a new level. The core elements of the original are spiced up by a number of important new features:
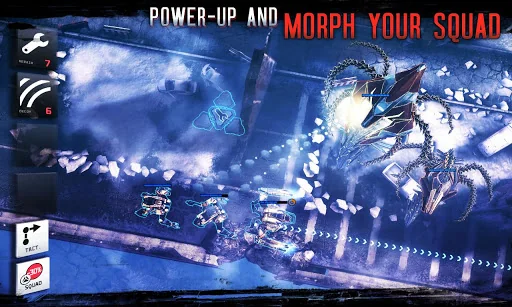
- Morph your troops into war mechs to discover the new face of strategy: each unit has a different mech form with various abilities to help you overcome specific combat situations.
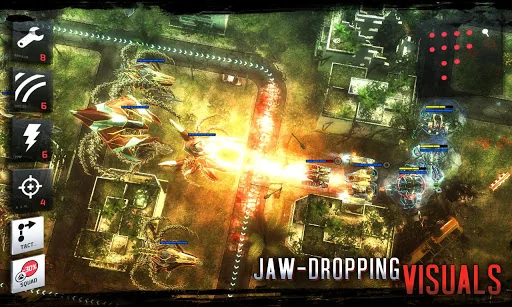
- Engage in a multiplayer experience unique to Anomaly 2: tower defense vs. tower offense. Play as the towers and destroy the humans or lead the humans to annihilate the alien towers.
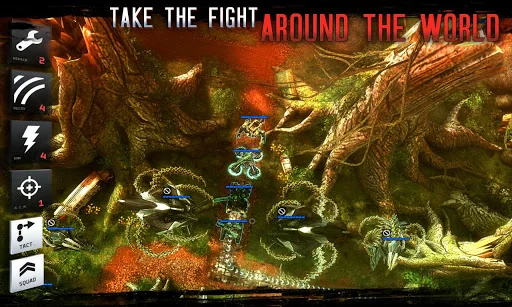
- Fight across a post-apocalyptic world in a new single-player campaign that offers a more intense strategy experience than the acclaimed original.
- Carve your own path to victory and create your ultimate battle squad. With over million tactical combinations to build your squad, your options in combat are nearly endless.
- Dive into a beautifully rendered world, thanks to the team’s upgraded and improved visual engine.
- Experience alternative endings dependent upon your approach to enemy machines in the campaign.
- Optimized for tablets
Comparable Android apps
The five apps in Strategy with the closest revenue to Anomaly 2. Click any to see its detail page.
Each forecast combines App Store rating, ratings count, monetisation model, pricing tier, IAP signals and ad-supported flag.
The base estimate is then multiplied by a per-category scaling factor learned from apps with founder-verified MRR.
Every number on this page comes from public APIs and bumetric's own snapshot history.
Full methodology covers input variables, accuracy bands per category and how we treat apps without comparable anchors.
See also the live data on Anomaly 2's tracker page for current rating, reviews and snapshot timeline.
Building something similar? Get a free AI audit with $-revenue forecasts for every recommendation.
 Great Big War Game
 Clash Royale
 Papa's Burgeria To Go!
 Organ Trail: Director's Cut
 Papa's Pizzeria To Go!