What Easy Dashboard actually does (from store listing)
Easy Dashboard – Trade Smarter, Not Harder
Stop overcomplicating your trading.
--------------------------------
Why traders use Easy Dashboard
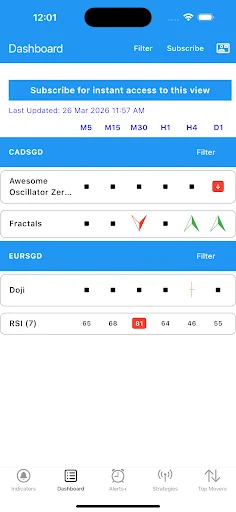
• See everything at a glance
Analyse multiple indicators across timeframes in a single dashboard. No need to switch charts.
• Make faster decisions
Clear signals help you spot opportunities quickly without overthinking.
• Never miss key setups
Get alerts when important conditions are met so you can act on time.
• Customise your str…
• See everything at a glance
Analyse multiple indicators across timeframes in a single dashboard. No need to switch charts.
• Make faster decisions
Clear signals help you spot opportunities quickly without overthinking.
• Never miss key setups
Get alerts when important conditions are met so you can act on time.
• Customise your strategy
Use Alerts+ to create your own rules based on your trading style.
• Focus on what matters
Identify the most active markets with Top Movers and avoid low volatility pairs.
• Built for clarity
Clean, consistent interface designed for both beginners and experienced traders.
--------------------------------
What you get
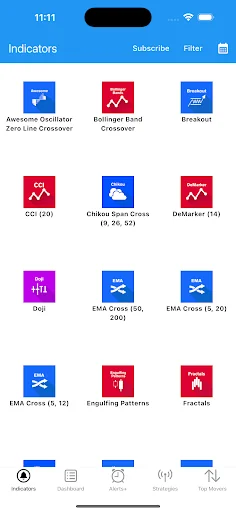
• Multiple indicators in one unified dashboard
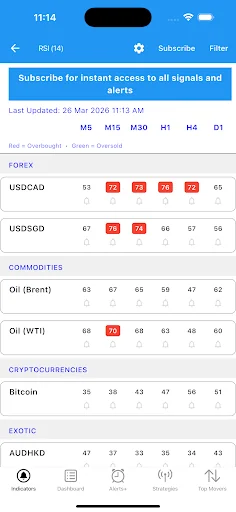
• Multi-timeframe analysis (M5 to Monthly)
• Smart alerts and advanced Alerts+
• Built-in trading strategies
• Daily Top Movers to track volatility
--------------------------------
Popular Indicators Included
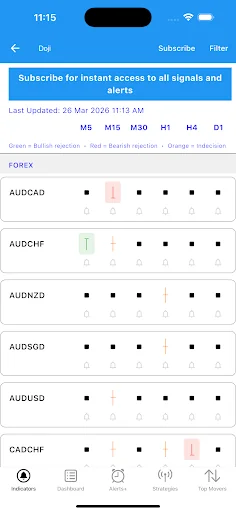
ADX, RSI, MACD, Bollinger Bands, EMA Cross, Ichimoku, Stochastic, Williams %R, PSAR, CCI, ATR, Momentum, Engulfing, Doji, Fractals and more.
--------------------------------
Built-in Strategies
• Multi-Timeframe RSI
• RSI Divergence
--------------------------------
Upgrade for Full Access
Unlock all indicators, alerts, and features with a subscription.
Subscriptions renew automatically unless cancelled at least 24 hours before the end of the current period.
Pricing starts from USD 2.99/month or USD 29.99/year.
Each forecast combines App Store rating, ratings count, monetisation model, pricing tier, IAP signals and ad-supported flag.
The base estimate is then multiplied by a per-category scaling factor learned from apps with founder-verified MRR.
Every number on this page comes from public APIs and bumetric's own snapshot history.
Full methodology covers input variables, accuracy bands per category and how we treat apps without comparable anchors.
See also the live data on Easy Dashboard's tracker page for current rating, reviews and snapshot timeline.
Building something similar? Get a free AI audit with $-revenue forecasts for every recommendation.

 DipuPay - Diputación de Cádiz
 Pleo
Pleo
 Fair Loans
 KEAZ
KEAZ
 ConsigFácil