ML revenue forecast.
Calibrated against 5756 apps in this category.
Confidence band
±15%
High — many comparable apps with verified data
At a glance
Earns 20.57× more than the category median (254/mo).
Ranks #58 of 5,756 in Card (top 1.0% by revenue).
Launched Jun 18, 2012 · last updated Aug 10, 2024.
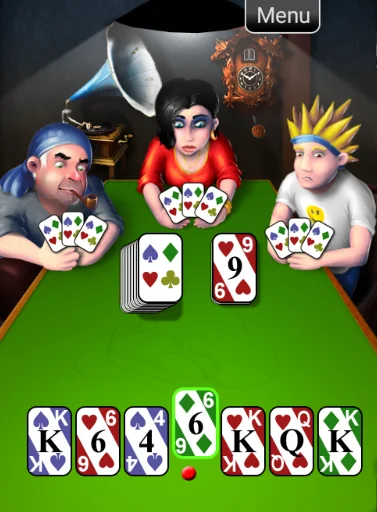
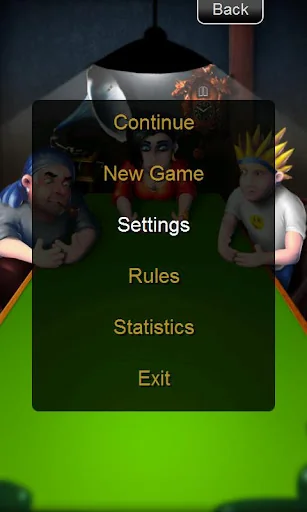
What the app looks like
Live screenshots from the Play Store, captured by our snapshot worker. Tap any image to enlarge.
Mau Mau's revenue trajectory
Forecast revenue from snapshot history. Last 1 months.
Where Mau Mau sits in Card
Revenue distribution of 5756 comparable apps. Mau Mau highlighted.
Mau Mau vs comparable apps
Revenue trajectory side-by-side. Bold = Mau Mau, ghosted = peers.
App spec
Version
3.34
Last update
Aug 10, 2024
Launched
Jun 18, 2012
Price
$1.70
Monetization
Paid
What Mau Mau actually does (from store listing)
Mau Mau is a classic card game on your mobile phone screen for two to four players. The game is played against three computer opponents, so that a total of four players can participate in the game. The player may choose in the menu a different number of players (two to four) and select which players should be present.
The player's cards are located at the bottom of the screen. The game is turn-based, each time a player moves, (s)he either plays card from hands or takes a card from the base pi…
Mau Mau is a classic card game on your mobile phone screen for two to four players. The game is played against three computer opponents, so that a total of four players can participate in the game. The player may choose in the menu a different number of players (two to four) and select which players should be present.
The player's cards are located at the bottom of the screen. The game is turn-based, each time a player moves, (s)he either plays card from hands or takes a card from the base pile. The goal of the game is to get rid of all the cards from the hand.
Those three guys don't cheat. They get same random cards as you, and don't see each other's cards or under the pile. They use their own logic to play, same like you can.
Comparable Android apps
The five apps in Card with the closest revenue to Mau Mau. Click any to see its detail page.
Each forecast combines App Store rating, ratings count, monetisation model, pricing tier, IAP signals and ad-supported flag.
The base estimate is then multiplied by a per-category scaling factor learned from apps with founder-verified MRR.
Every number on this page comes from public APIs and bumetric's own snapshot history.
Full methodology covers input variables, accuracy bands per category and how we treat apps without comparable anchors.
See also the live data on Mau Mau's tracker page for current rating, reviews and snapshot timeline.
Building something similar? Get a free AI audit with $-revenue forecasts for every recommendation.


 SmartPref
 WSOP Poker: Texas Holdem Game
 Hearthstone
 Belote Andr
 Solitaire - Classic Card Games