What Neon Chrome actually does (from store listing)
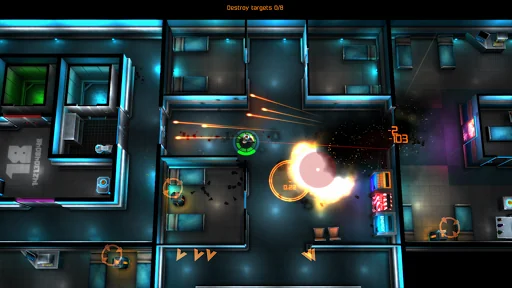
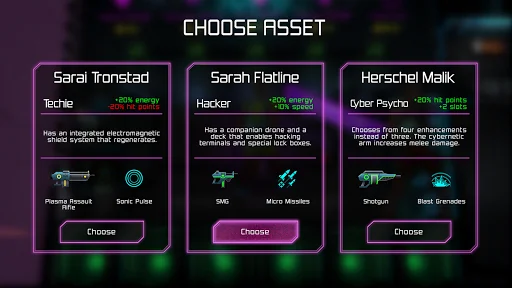
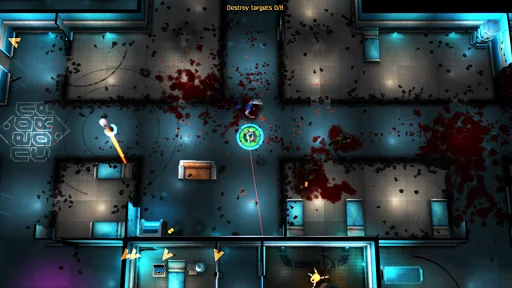
Neon Chrome is an infinite twin-stick top-down shooter with procedurally generated levels and destructible environment. Choose your character, enter the elevator and try to bring down the Overseer - again and again. Neon Chrome is an endless symphony of fight, die, improve and repeat - many players have over 100 hours logged!
Neon Chrome is high end game filled with massive explosions, destructible environment, countless bullets and rich AI behavior. Older devices may struggle to run the game…
Neon Chrome is an infinite twin-stick top-down shooter with procedurally generated levels and destructible environment. Choose your character, enter the elevator and try to bring down the Overseer - again and again. Neon Chrome is an endless symphony of fight, die, improve and repeat - many players have over 100 hours logged!
Neon Chrome is high end game filled with massive explosions, destructible environment, countless bullets and rich AI behavior. Older devices may struggle to run the game with high frame rate.
- Procedurally generated levels - true endless replayability
- Completely destructible environment
- Persistent RPG-like character development using loot from your runs
- Enemies ranging from security guards to massive boss hover tanks
- Perk system in the form of cybernetic enhancements
- Discover & unlock enhancements, abilities and weapons
Neon Chrome was created by 10tons - the company behind the cult hit game Crimsonland.
Comparable Android apps
The five apps in Action with the closest revenue to Neon Chrome. Click any to see its detail page.
Each forecast combines App Store rating, ratings count, monetisation model, pricing tier, IAP signals and ad-supported flag.
The base estimate is then multiplied by a per-category scaling factor learned from apps with founder-verified MRR.
Every number on this page comes from public APIs and bumetric's own snapshot history.
Full methodology covers input variables, accuracy bands per category and how we treat apps without comparable anchors.
See also the live data on Neon Chrome's tracker page for current rating, reviews and snapshot timeline.
Building something similar? Get a free AI audit with $-revenue forecasts for every recommendation.


 slither.io
 Banana Kong
 Pixel Gun 3D - FPS Shooter
 Hills Legend: Horror (HD)
 Mortal Crusade