✨ Core features of this App
1) 🔍 Media Scanner: automatically scan all folders to find out all the media files, including those not in the media store.
☞ On Android 11 and above, You need to manually add the folders to be scanned.
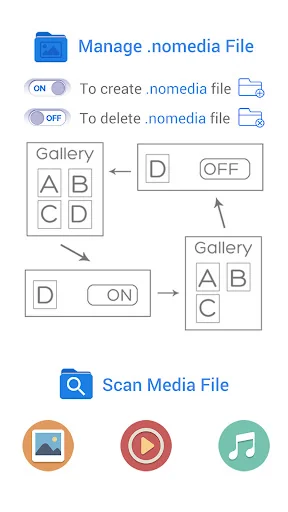
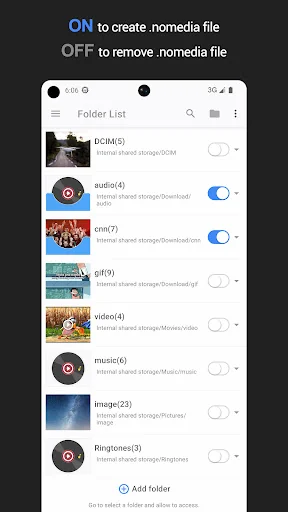
2) 📁 Create or delete the ".nomedia" file in any folders: "ON" means to create a .nomedia file in a folder, "OFF" means to delete the .nomedia file from a folder.
💫 There are two view modes to manage, viewing media files and .nomedia files
1) Folder list mode:…
✨ Core features of this App
1) 🔍 Media Scanner: automatically scan all folders to find out all the media files, including those not in the media store.
☞ On Android 11 and above, You need to manually add the folders to be scanned.
2) 📁 Create or delete the ".nomedia" file in any folders: "ON" means to create a .nomedia file in a folder, "OFF" means to delete the .nomedia file from a folder.
💫 There are two view modes to manage, viewing media files and .nomedia files
1) Folder list mode: more convenient, the default mode.
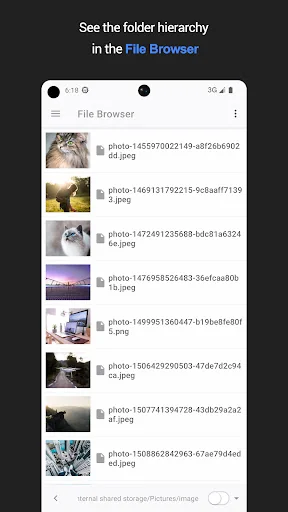
2) File browser mode: advanced mode, works like a file manger.
ℹ️※ What can it do?
📁 1. Create ".nomedia" file in the containing directory signaling the media scanner to ignore media, so as to hiding useless and redundant media file(image/photo, music, video) in Gallery, Music Player, Video Player and other APP base on media store.
🔍 2. Use as a media scanner, find out all the media file(image/photo, music, video) on your device, and update to the media store, so you can view the media file in Gallery, Music Player, Video Player and other APP base on media store.
ℹ️※ What is this:
This APP can help you to create or remove a file called .nomedia in a
folder contains media files easily. And refresh MediaStore immediately!
ℹ️※ What is a .nomedia file?
.nomedia file signaling the media scanner to ignore media in the containing directory and its subdirectories. This prevents media scanner from reading your media files(image, video, audio) and providing them to other apps(Gallery, Music Player, Video Player etc.) through the MediaStore content provider.
If you want to scan all the photo/image/music/video on your device;
If the Gallery, Media Player always load some pictures, videos or audios which you do think are useless, redundant.
Then this APP may be what you need.
📌Note:
The main purpose of this app is let the junk media files(which we do think) don't show in some APP(such as the Gallery, Play Music) based on MediaStore. It is not a tool to hide files and protect your privacy, as files may be show in file manager APPs.
ℹ️※ How to use:
1. The application will scan picture, video, audio files from the MediaStore and file system, and then categorizes them by folder.
2. When a folder is set to "ON," means that media files in this folder will NOT be scanned by MediaStore, otherwise will be scanned.
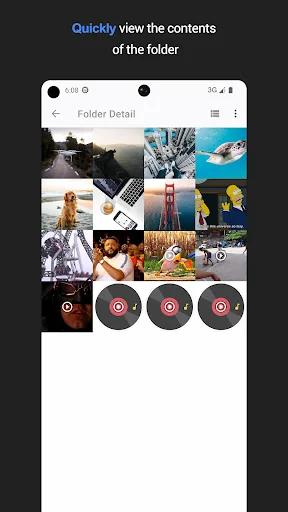
3. In the list view, click the folder preview to view folder detail.
4. In the grid view, click the file preview can play the media file.
⚠️ Warning: This APP may NOT work on SOME devices. It may cause files to be deleted automatically on SOME Samsung devices. Anyway you can try it out. It's a good idea to try it on unimportant folders/files firstly.
Comparable Android apps
The five apps in Tools with the closest revenue to Nomedia. Click any to see its detail page.
Each forecast combines App Store rating, ratings count, monetisation model, pricing tier, IAP signals and ad-supported flag.
The base estimate is then multiplied by a per-category scaling factor learned from apps with founder-verified MRR.
Every number on this page comes from public APIs and bumetric's own snapshot history.
Full methodology covers input variables, accuracy bands per category and how we treat apps without comparable anchors.
See also the live data on Nomedia's tracker page for current rating, reviews and snapshot timeline.
Building something similar? Get a free AI audit with $-revenue forecasts for every recommendation.

 Rastreamento - Encomendas
 ecoATM
 Reminder
 Screen Recorder Video Recorder
 Anatel Consumidor