<b>Unleash the Carnage in Smash Up: Digital Edition!</b> 💥
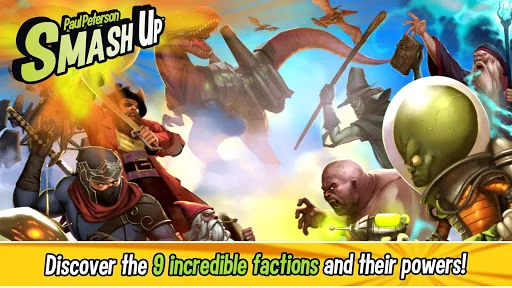
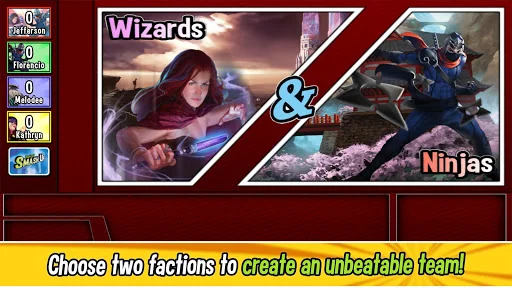
Get ready for chaos in the digital edition of AEG’s shufflebuilding card game, Smash Up. Choose two faction decks from Pirates, Ninjas, Robots, Zombies, and more to create a hybrid team that is a force to be reckoned with!
<b>No Game is the Same... No Faction is the Same!</b>
Mash up two factions into a 40-card deck. With each faction offering unique mechanics, every game is a new and exciting challenge.
<b>Think Strategy!</b>
…
Unleash the Carnage in Smash Up: Digital Edition! 💥
Get ready for chaos in the digital edition of AEG’s shufflebuilding card game, Smash Up. Choose two faction decks from Pirates, Ninjas, Robots, Zombies, and more to create a hybrid team that is a force to be reckoned with!
No Game is the Same... No Faction is the Same! Mash up two factions into a 40-card deck. With each faction offering unique mechanics, every game is a new and exciting challenge.
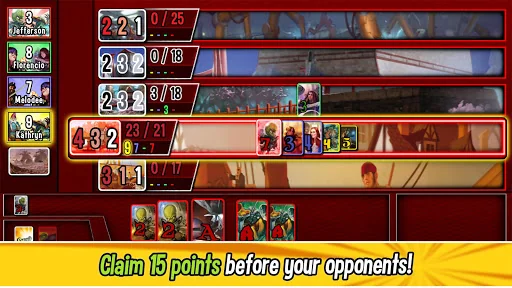
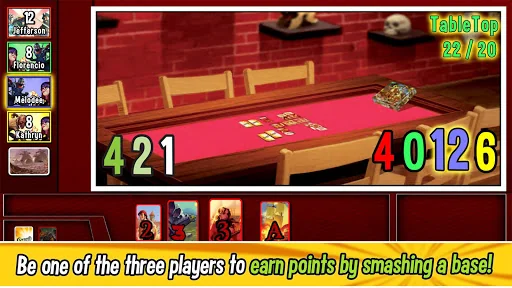
Think Strategy! You only need 15 points to win the game… Sounds easy? Not when another player has a Pirate-Dinosaur deck that sails into your base and releases King Rex to stomp your minions. Plan ahead, or face defeat!
What’s your first Smash Up going to be? 🤖➕🧟, 🦖➕👽 or ☠️➕🧙?
Features: • Online Cross-Platform Multiplayer: Play with 2 to 4 players.
• Leaderboards & Achievements: Track your progress and compete with others.
• Tutorial System: Plus ‘Step Through’ and ‘Review’ modes to help you learn the game.
Comparable Android apps
The five apps in Board with the closest revenue to Smash Up. Click any to see its detail page.
Each forecast combines App Store rating, ratings count, monetisation model, pricing tier, IAP signals and ad-supported flag.
The base estimate is then multiplied by a per-category scaling factor learned from apps with founder-verified MRR.
Every number on this page comes from public APIs and bumetric's own snapshot history.
Full methodology covers input variables, accuracy bands per category and how we treat apps without comparable anchors.
See also the live data on Smash Up's tracker page for current rating, reviews and snapshot timeline.
Building something similar? Get a free AI audit with $-revenue forecasts for every recommendation.

 Checkers Online
 Yachty Premium
 Bingo Blitz™️ - Bingo Games
 Thermo Sudoku
 Ludo STAR: Online Dice Game