What TipRanks Stock Market Analysis actually does (from App Store listing)
Join millions of users who use TipRanks to track stocks, manage investment portfolios, access financial business data, improve investment strategy with Wall Street analysts and financial experts' tips, and stay on top of stock market news.
TipRanks is a one-stop finance and stock market app that offers a suite of simplified stock research tools, including:
• Analysis of market trends and opinions from industry analysts
• Data-driven scores based on market factors
• News and research about your …
Join millions of users who use TipRanks to track stocks, manage investment portfolios, access financial business data, improve investment strategy with Wall Street analysts and financial experts' tips, and stay on top of stock market news.
TipRanks is a one-stop finance and stock market app that offers a suite of simplified stock research tools, including: • Analysis of market trends and opinions from industry analysts • Data-driven scores based on market factors • News and research about your Watchlist stocks • Real-time quotes, stock futures, charts, and data for your favorite stocks and indices • Stay up to date with stock alerts, stocks tracker, stock signals, stocks to buy, hot stocks, stock prices, trending Stocks, etc.
Whether you are an aspiring investor or an experienced investor, you can leverage investment opportunities and invest like a pro when you have access to the best data and research tools.
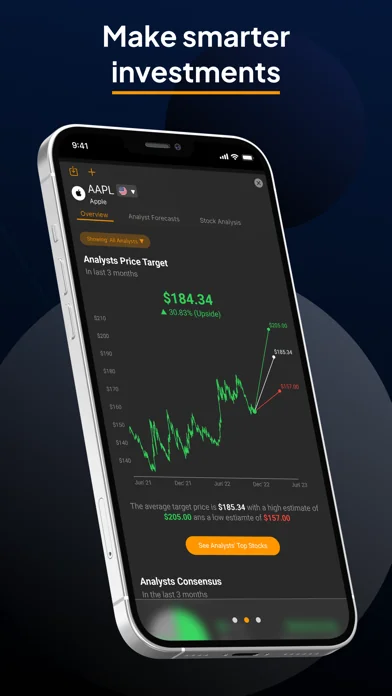
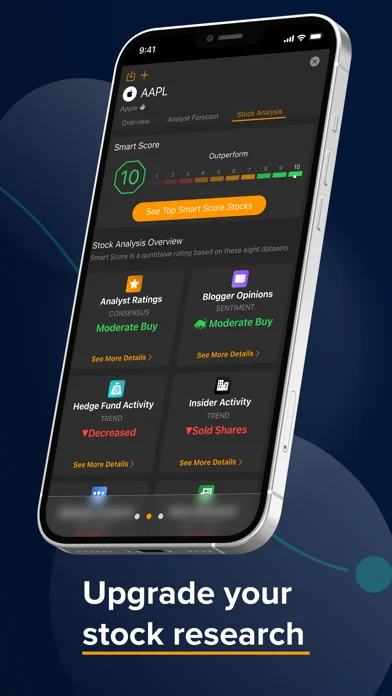
RESEARCH TOOLS & REAL-TIME DATA - Find out what experts think are the best stock picks, based on their top ratings - Analyze data according to your investment strategy and gain a comprehensive real-time view of stocks - Utilize our smart, data-driven score, based on different market factors, to gain immediate insight into your portfolio stocks
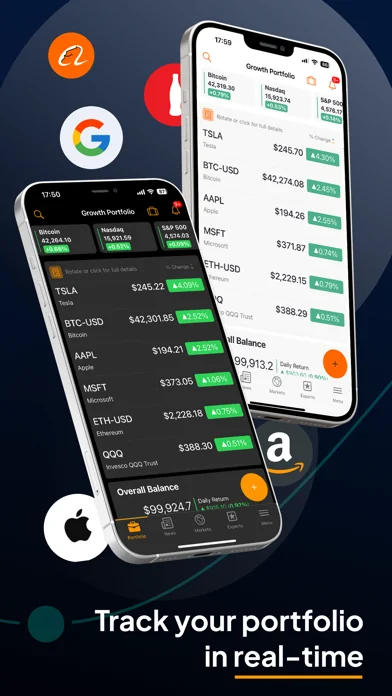
STOCK PORTFOLIO TRACKER & STOCK WATCHLIST - Sync or create a portfolio to receive a full analysis and actionable insights - Build your customized Watchlist and keep track of stock quotes - You may access your Watchlist at any time for current stock prices, and your Holdings portfolio provides you with a 24/7 view of your total asset value
STOCK MARKET NEWS & ANALYSIS - Get the latest market news including insightful stock insights, top analysts' recommendations, and Strong Buy and Strong Sell stocks - Learn which corporate insiders are buying stocks and follow their transactions - Keep track of top daily gainers or losers, upcoming events, IPOs, earnings, etc.
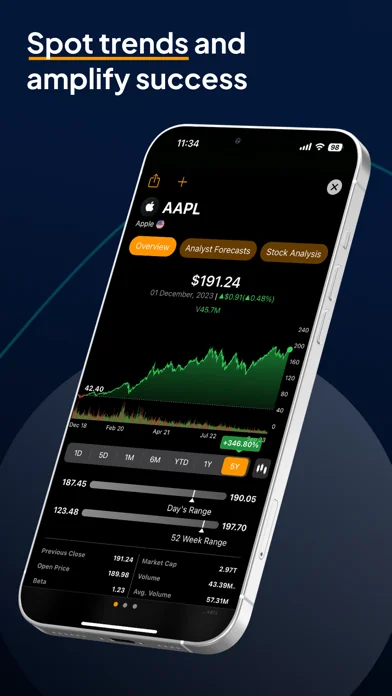
STOCK ALERTS & CHARTS - Receive push notifications or email alerts about your favorite stocks and experts - Keep track of all your notifications with our handy Alert Center - Obtain key information about stock charts, including statistics, earnings, dividends, stock price targets, and forecasts from expert analysts
PREMIUM SUBSCRIPTION • Advanced Stock Research - First-class market intelligence, sourced from unique algorithms • Analysts' Top Stocks - Put the best Wall Street analysts to work for you and get access to the stocks they rate as Strong Buys and Strong Sells • Smart Score Stocks - Discover stocks, using our data-driven scoring system • Daily Analyst Ratings - Reviews the daily Buy and sell recommendations of over 7700 analysts • Stock Screener - Use our simplified screener to search for stocks according to your preferences • Insiders' Hot Stocks and Trending Stocks - Monitor insider activity and discover best-rated stocks by analysts, from the last 72 hours • Stock Comparison - Discover each stock’s price target as well as recommendations by top Wall Street experts
Make sure to download the TipRanks app and stay up to date as the stock market moves.
Privacy Policy: https://www.tipranks.com/privacypolicy Terms of Use https://www.tipranks.com/terms
🆕 What's new · v3.47.6
This version contains bug fixes and performance improvements.
Comparable iOS apps
The five apps in Finance with the closest revenue to TipRanks Stock Market Analysis. Click any to see its detail page.
Each forecast combines App Store rating, ratings count, monetisation model, pricing tier, IAP signals and ad-supported flag.
The base estimate is then multiplied by a per-category scaling factor learned from apps with founder-verified MRR.
Every number on this page comes from public APIs and bumetric's own snapshot history.
Full methodology covers input variables, accuracy bands per category and how we treat apps without comparable anchors.
See also the live data on TipRanks Stock Market Analysis's tracker page for current rating, reviews and snapshot timeline.
Building something similar? Get a free AI audit with $-revenue forecasts for every recommendation.

 Haushaltsbuch, Kosten Mánager
 Splitwise
 Military Retirement
 Rechnung und angebot schreiben
 stock3