What Velogram for Strava Cycling actually does (from App Store listing)
Create brilliant infographics from your Strava data:
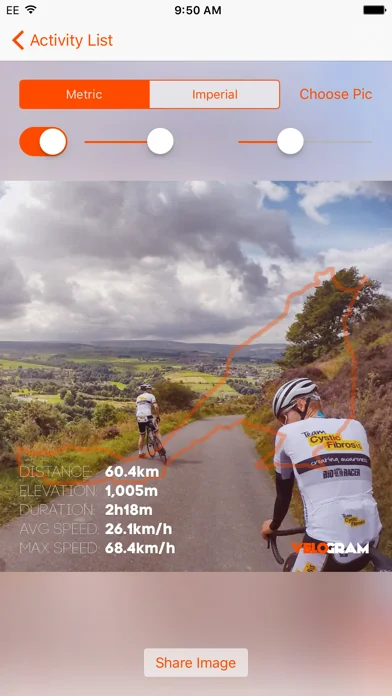
• Overlay Elevation, Route and Stats onto your own images
• ActivityArt - produces artwork from your activities that you can use as posters, wallpapers etc.
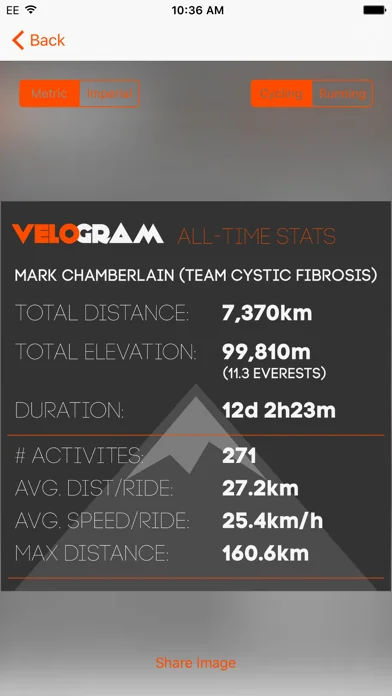
• All-Time Statistics
• Year-To-Date Statistics
• Last 4-Weeks Statistics
• Historical Stats - Year-by-Year & Previous Months
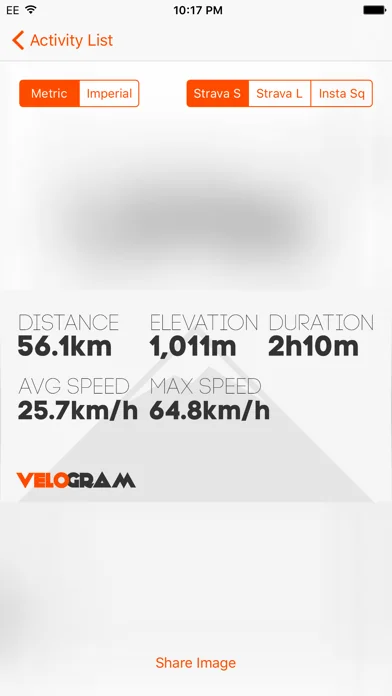
• Individual Activity Statistics
• Friends Activity Statistics
• K/QOM & CR Statistics
• Projected Distances
• Beer, Wine, and Cake Calculator!
Once you've chosen…
Create brilliant infographics from your Strava data:
• Overlay Elevation, Route and Stats onto your own images • ActivityArt - produces artwork from your activities that you can use as posters, wallpapers etc. • All-Time Statistics • Year-To-Date Statistics • Last 4-Weeks Statistics • Historical Stats - Year-by-Year & Previous Months • Individual Activity Statistics • Friends Activity Statistics • K/QOM & CR Statistics • Projected Distances • Beer, Wine, and Cake Calculator!
Once you've chosen the type of infographic you require, the image is created ready for you to share via e-mail, SMS, Twitter, Facebook, Instagram, and of course to your device itself.
When creating Activity-based images, you can use the specific-dimensioned templates which look great when uploaded to the Strava app.
Velogram also enables the user to take a Strava activity (run or ride) and CLONE an existing one to be a new activity - useful for when your Garmin has crashed and you've done a similar ride/run before. Velogram also allows you to BOOST existing rides/runs!!
🆕 What's new · v2.6.11
• ActivityArtwork now working properly on B&W mode
• Updated PhotoPicker in ActivityPix now working as intended, iCloud photo compatible and some orientation bugs fixed
Comparable iOS apps
The five apps in Health & Fitness with the closest revenue to Velogram for Strava Cycling. Click any to see its detail page.
Each forecast combines App Store rating, ratings count, monetisation model, pricing tier, IAP signals and ad-supported flag.
The base estimate is then multiplied by a per-category scaling factor learned from apps with founder-verified MRR.
Every number on this page comes from public APIs and bumetric's own snapshot history.
Full methodology covers input variables, accuracy bands per category and how we treat apps without comparable anchors.
See also the live data on Velogram for Strava Cycling's tracker page for current rating, reviews and snapshot timeline.
Building something similar? Get a free AI audit with $-revenue forecasts for every recommendation.


 Army Survival Skills
 The WOD Timer - Workout Timer
 21 Tage Stoffwechselkur
 SleepStream 2 Ultimate
 Enduco: Laufpläne & Radfahren