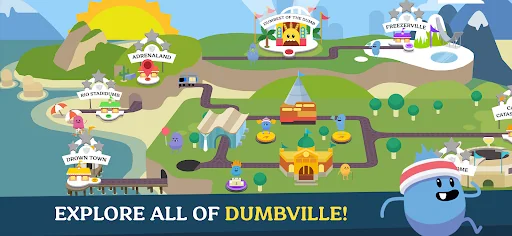
Dumb Ways to Die 2: The Games

 75
75


This casual title carves out a niche in the quirky, mini-game compilation genre, directly competing with other physics-based, reaction-time games like *Fall Guys* or even hyper-casual titles from studios like Voodoo. With over a million ratings and a solid user score, this app demonstrates significant traction and a mature user base, indicating it's well past initial launch and in a sustained growth or maintenance phase. The free monetization model, common in casual gaming, suggests a reliance on ad revenue. For this category, a typical monetization observation is that a significant portion of revenue often comes from rewarded video ads, which can be optimized by offering in-game currency or retries for engagement, rather than just interstitial ads that disrupt gameplay. PlaySide Studios could explore more integrated IAP options, like character customization or cosmetic packs, which are often overlooked in free casual games but can significantly boost ARPU.
BU Score 75 · Strong — healthy traction. The full Investment Matrix below scores 8 dimensions including monetisation, growth, and operational risk.
Track snapshot history and revenue forecast in the Performance section below.
- Title & subtitle keyword fit
- Description hook & conversion structure
- Screenshots, ratings, reviews strategy
📊 Performance Tracking LIVE
Synthetic estimate. Inputs: category complexity, file size, screen count, monetization layer, platform reach, age × team-size proxy. Calibrated against 2024-2026 indie-agency rate surveys. Full math + source list on /methodology.
| 🧱 MVP baseline (design + 1-store ship) | +$28K |
| 📱 5 unique screens × $4.5K | +$22K |
| 💎 In-app purchase plumbing | +$9K |
| ⚙ Casual complexity ×1.50 | +$29K |
| 🌐 Cross-platform reach (iOS + Android) | +$49K |
Synthetic estimate. Multiple band derived from iap / freemium model + age, rating quality, category demand, and user-base maturity. Calibrated against 2024-2026 indie-app-marketplace closed-deal medians. Full math + comparable deal list on /methodology.
| 💎 IAP / freemium model base | 28× MRR |
| ⭐ ★ rating 3.5-4.0 (mixed) | -8% |
| 🏷 Casual category multiple | -22% |
| ⭐ Mature user base (1M+ ratings) | +8% |
Synthetic estimate from ratings × category benchmarks. Calibrated against 2024-2026 mobile-attribution retention + DAU/MAU reports. Numbers are US-storefront-equivalent — true global audience can be 5-10× larger for international apps. Full math + source list on /methodology.
| 📲 Casual engagement | ~220 installs / rating |
| 🔁 Casual D30 retention | 6% |
| 📍 DAU / MAU stickiness | 0.35 |
Heuristic guess from app bundle size, category, store description signals, and release-date stack era. Bumetric does not disassemble binaries — for binary-level certainty you would need an SDK intelligence tool or the manifest itself. Reasoning chain on the right. Full ruleset on /methodology.
| 🏷 Category context | Casual |
| 📦 Tiny game bundle | → Native 2D engine |
How we forecast this revenue
MEDIUM CONFIDENCEBU Investment Matrix
Mixed signals · 58/100BIG TIERcompetitive but cautious- 💰 Revenue: Healthy — $280K - $1540K/mo · BIG tier · medium-low confidence, trajectory unclear.
- ⭐ Quality: 3.86★ across 1,746,971 reviews — strong (top 10%).
- 📍 Market: Not yet charting in any of the 9 monitored markets.
- 📈 Growth: Insufficient signal to assess trajectory.
- ⚠️ Risk: Low — no material risk signals detected.
💰 Forecast Revenue / mo
MODEL| High install base (1,746,971 ratings)METRIC | +$12,000 | |
| 5 starREVIEW | +$1,800 | |
| Mature app (11y old)METRIC | +$1,500 | |
| Ad-supported / freemiumMETRIC | +$600 |
📈 Reviews Growth
LIVE⭐ Rating Trend
LIVEProfile & Insights
Identification
- App name
- Dumb Ways to Die 2: The Games
- Developer
- PlaySide Studios Ltd
- Bundle ID
- air.au.com.metro.DumbWaysToDie2
- App Store URL
- Open in App Store
- Category
- Casual
- Content rating
- Not found
- Languages
- Not found
Company
- Website
- dumbwaystodie.com
- Tagline
- Not found
- Description
- Not found
- Founded
- Not found
- HQ / Address
- Not found
- Employees
- Not found
- Logo
- Not found
Revenue
- Verified revenue / mo
- Not found
- AI revenue estimate / mo
- Not found
- AI annual estimate
- Not found
- ML model estimate / mo
- $218/mo
- Top-grossing rank
- Not found
- All-time revenue
- Not found
- Pricing
- $0.99 - $4.99 per item
Founder
Funding
Press & Links
Contacts & Socials
📈Ratings growth1,746,971 ratings+33% lifetimeShow 3-year history estimate ▾
📝 About this app
Dumb Ways to Die 2: The Games has taken the world by storm.
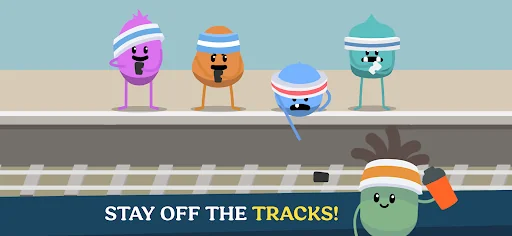
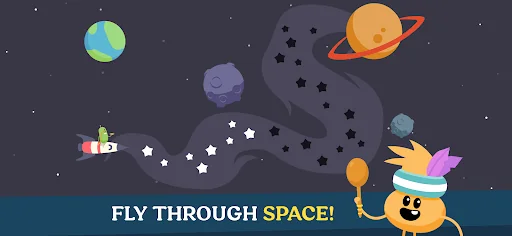
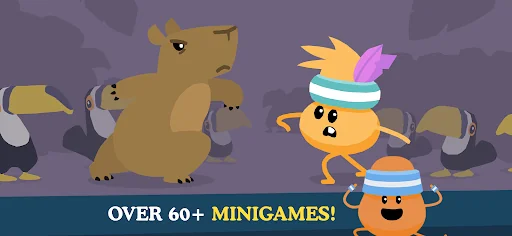
Boasting all new levels and challenges, leader boards, as well as a cast of new characters, Dumb Ways to Die 2: The Games is bringing train safety message to the world in a cheeky and fun way.
External Storage privileges are required for .OBB files and also for caching advertisements on the device.
Track this app’s revenue
FREE📝 Description
95
More by PlaySide Studios Ltd
View all →


Similar apps in Casual


Why high confidence: 1,746,971 ratings · no founder-verified revenue (model estimate only).