Investing.com: Stock Market


 82
82


Investing.com: Stock Market is an Android app from INVESTING.com in the Finance category, currently rated 4.7★ across 1,071,152 ratings. Initial signal reads as largely positive sentiment, users highlighting consistency and feature depth.
Quality Score is 82: Excellent (strong product-market fit). For a Finance app, that means strong product-market fit. The full BU Investment Matrix below scores 8 dimensions including monetisation, growth, and operational risk.
Track changes month-over-month in the Performance section below: live snapshot history and revenue forecast included.
- Title & subtitle keyword fit
- Description hook & conversion structure
- Screenshots, ratings, reviews strategy
📊 Performance Tracking LIVE
Synthetic estimate. Inputs: category complexity, file size, screen count, monetization layer, platform reach, age × team-size proxy. Calibrated against 2024-2026 indie-agency rate surveys. Full math + source list on /methodology.
| 🧱 MVP baseline (design + 1-store ship) | +$28K |
| 📱 5 unique screens × $4.5K | +$22K |
| 💎 In-app purchase plumbing | +$9K |
| ⚙ Finance complexity ×1.60 | +$35K |
| 🌐 Cross-platform reach (iOS + Android) | +$52K |
Synthetic estimate. Multiple band derived from iap / freemium model + age, rating quality, category demand, and user-base maturity. Calibrated against 2024-2026 indie-app-marketplace closed-deal medians. Full math + comparable deal list on /methodology.
| 💎 IAP / freemium model base | 28× MRR |
| ⭐ ★ rating ≥ 4.4 (solid) | +8% |
| 🏷 Finance category multiple | +15% |
| ⭐ Mature user base (1M+ ratings) | +8% |
Synthetic estimate from ratings × category benchmarks. Calibrated against 2024-2026 mobile-attribution retention + DAU/MAU reports. Numbers are US-storefront-equivalent — true global audience can be 5-10× larger for international apps. Full math + source list on /methodology.
| 📲 Finance engagement | ~60 installs / rating |
| 🔁 Finance D30 retention | 28% |
| 📍 DAU / MAU stickiness | 0.40 |
How we forecast this revenue
MEDIUM CONFIDENCEBU Investment Matrix
Mixed signals · 59/100BIG TIERcompetitive but cautious- 💰 Revenue: Healthy — $800K - $4400K/mo · BIG tier · medium-low confidence, trajectory unclear.
- ⭐ Quality: 4.67★ across 1,071,152 reviews — exceptional (top 1% in category).
- 📍 Market: Not yet charting in any of the 9 monitored markets.
- 📈 Growth: Insufficient signal to assess trajectory.
- ⚠️ Risk: Low — no material risk signals detected.
💰 Forecast Revenue / mo
MODEL| High install base (1,071,152 ratings)METRIC | +$12,000 | |
| Excellent rating (4.7★)METRIC | +$2,200 | |
| Mature app (12y old)METRIC | +$1,500 | |
| slowREVIEW | −$1,200 | |
| Ad-supported / freemiumMETRIC | +$600 |
📈 Reviews Growth
LIVE⭐ Rating Trend
LIVEProfile & Insights
Identification
- App name
- Investing.com: Stock Market
- Developer
- INVESTING.com
- Bundle ID
- com.fusionmedia.investing
- App Store URL
- Open in App Store
- Category
- Finance
- Content rating
- Not found
- Languages
- Not found
Company
- Website
- www.investing.com
- Tagline
- Not found
- Description
- Not found
- Founded
- Not found
- HQ / Address
- Not found
- Employees
- Not found
- Logo
- Not found
Revenue
- Verified revenue / mo
- Not found
- AI revenue estimate / mo
- Not found
- AI annual estimate
- Not found
- ML model estimate / mo
- $103/mo
- Top-grossing rank
- Not found
- All-time revenue
- Not found
- Pricing
- $0.99 - $538.80 per item
Founder
Funding
Press & Links
Contacts & Socials
📈Ratings growth1,071,152 ratings+37% lifetimeShow 3-year history estimate ▾
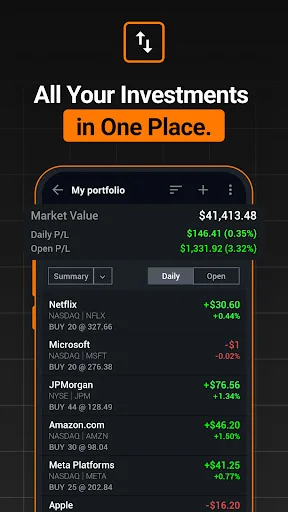
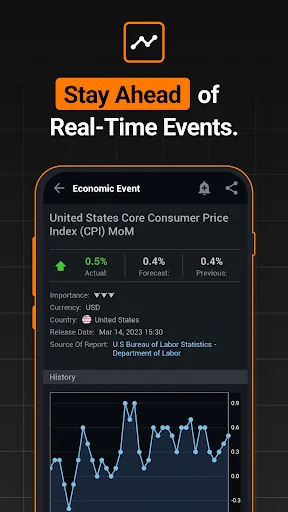
📝 About this app
Stay ahead in the stock market with the Investing.com app. Get real-time market data, news, and live updates on major indices like the Dow Jones, NASDAQ and S&P 500. Use our portfolio tracker to monitor stocks, indices, ETFs and commodities.… View full description on the official store →
What Worked™ · Development Pipeline
3 EVENTS TRACKEDTrack this app’s revenue
FREE📝 Description
95
More by INVESTING.com
View all →


Why high confidence: 1,071,152 ratings · no founder-verified revenue (model estimate only).