1.1M Android Apps Tracked Updated just now Revenue Forecasts
Create Account Sign In
Home

Expense Tracker: EasyBudget

77
Quality Score
Strong

Expense Tracker: EasyBudget

High confidence
4.8 ✍️ Editor
✍️ bumetric analysis

Expense Tracker: EasyBudget is an Android app from TinyCraft in the Finance category, currently rated 4.8★ across 84,597 ratings. Initial signal reads as largely positive sentiment, users highlighting consistency and feature depth.

Quality Score is 77: Strong (healthy traction). For a Finance app, that means healthy traction. The full BU Investment Matrix below scores 8 dimensions including monetisation, growth, and operational risk.

Track changes month-over-month in the Performance section below: live snapshot history and revenue forecast included.

💰 Monthly revenue · now vs forecast
● Right now
$5.0K
per month
12-mo forecast
$5.2K – $10.8K
per month
24-mo forecast
$6.4K – $19.2K
per month
MID tier
💡 Grow this revenue
Free AI audit of this app’s store listing
  • Title & subtitle keyword fit
  • Description hook & conversion structure
  • Screenshots, ratings, reviews strategy
Run free AI audit →
Typical impact: +2-5× organic installs
🔔Notify me when this app's revenue changes by

📊 Performance Tracking LIVE

Loading…
idle
0%
Rating
Reviews
Forecast Revenue / mo
Snapshots tracked
0
since first record
ONE-TIME · BUILD 💰 Estimated build cost
$150K
What it cost to build · not monthly revenue
Likely range $110K – $200K
$25K · MVP floor $100K · indie scale $500K+ · studio build
📈 Slow ROI — current MRR is well below build cost

Synthetic estimate. Inputs: category complexity, file size, screen count, monetization layer, platform reach, age × team-size proxy. Calibrated against 2024-2026 indie-agency rate surveys. Full math + source list on /methodology.

Where the money goes
🧱 MVP baseline (design + 1-store ship) +$28K
📱 5 unique screens × $4.5K +$22K
💎 In-app purchase plumbing +$9K
Finance complexity ×1.60 +$35K
🌐 Cross-platform reach (iOS + Android) +$52K
Total estimate $150K
ONE-TIME · EXIT VALUE 💵 Estimated acquisition value
$50K
What it would sell for · not monthly revenue
Marketplace range $35K – $75K · 37× MRR multiple
💸 ~0.3× build cost (under-water)

Synthetic estimate. Multiple band derived from iap / freemium model + age, rating quality, category demand, and user-base maturity. Calibrated against 2024-2026 indie-app-marketplace closed-deal medians. Full math + comparable deal list on /methodology.

How the multiple was built
💎 IAP / freemium model base 28× MRR
★ rating ≥ 4.7 (premium) +15%
🏷 Finance category multiple +15%
Final multiple 37× MRR
👥 Estimated audience size
5.0M
Lifetime downloads (US-equivalent)
Monthly active
1.4M
Daily active
560K

Synthetic estimate from ratings × category benchmarks. Calibrated against 2024-2026 mobile-attribution retention + DAU/MAU reports. Numbers are US-storefront-equivalent — true global audience can be 5-10× larger for international apps. Full math + source list on /methodology.

How we sized it
📲 Finance engagement ~60 installs / rating
🔁 Finance D30 retention 28%
📍 DAU / MAU stickiness 0.40
DAU / MAU 40% sticky
🔬

How we forecast this revenue

MEDIUM CONFIDENCE
Baseline
$5.0K/mo · ML-estimated from 234 triggers
Growth rate
+4.0% MoM · MID tier baseline (compound monthly)
6 months
$4.7K – $7.9K
12 months
$5.2K – $10.8K
24 months
$6.4K – $19.2K
Compound growth at +4.0% MoM (tier baseline for MID). Range widens with horizon — typical noise band ±25% at 6mo.. Ranges widen with horizon — distant futures carry more uncertainty.
📊

BU Investment Matrix

Below median · 54/100MID TIERunderperforming peers
RevenueQualityMarketGrowthMoatSafetyFounderMonetiz.
Revenue Strength
3.7
Product Quality
9.5
Market Position
0.0
Growth Velocity
5.0
Defensibility
6.0
Operational Safety
10.0
Founder Strength
4.1
Monetization Maturity
5.0
  • 💰 Revenue: Modest — $3K - $7K/mo · MID tier · medium confidence, trajectory unclear.
  • ⭐ Quality: 4.76★ across 84,597 reviews — exceptional (top 1% in category).
  • 📍 Market: Not yet charting in any of the 9 monitored markets.
  • 📈 Growth: Insufficient signal to assess trajectory.
  • ⚠️ Risk: Low — no material risk signals detected.
🎯 For competitors: Mixed picture. Worth competing if you have a clear UX or pricing edge — otherwise crowded segment.
💵 For acquirers: Estimated asking range 18-32× monthly = $90K-$160K.
Composite of 8 dimensions computed deterministically from public signals — no LLM, every score traces back to a measurable input. Default weights shown; "compete" / "acquire" / "invest" lenses re-weight without re-fetching.
Range:

💰 Forecast Revenue / mo

MODEL
Revenue forecast computed from BU's 234 trigger model on each snapshot. Calibrated against ground-truth from 58 verified-revenue apps.
🔬Forecast Breakdown — Why This Estimate?Top 4 of 4 triggers
Our ML model uses 200+ signals from public data. These are the most influential for this app:
Mid install base (84,597 ratings)METRIC
+$5,500
Excellent rating (4.8★)METRIC
+$2,200
Established app (6y old)METRIC
+$800
Ad-supported / freemiumMETRIC
+$600
METRIC = structural app data · REVIEW = mined from user reviews · ✓ VERIFIED = Stripe-verified anchor (TrustMRR)

📈 Reviews Growth

LIVE
Cumulative review count from first BU snapshot. Each point = a tracked update.

⭐ Rating Trend

LIVE
Average rating evolution. Updates with each new review batch.

Profile & Insights

Everything we know — and don't — about this app and its company.

Identification

App name
Expense Tracker: EasyBudget
Developer
TinyCraft
Bundle ID
com.hg.moneymanager.budgetapp
App Store URL
Open in App Store
Category
Finance
Content rating
Not found
Languages
Not found

Company

Website
fir-3260c.web.app
Tagline
Not found
Description
Not found
Founded
Not found
HQ / Address
Not found
Employees
Not found
Logo
Not found

Revenue

Verified revenue / mo
Not found
AI revenue estimate / mo
Not found
AI annual estimate
Not found
ML model estimate / mo
$1.3K/mo
Top-grossing rank
Not found
All-time revenue
Not found
Pricing
$0.99 - $13.99 per item

Founder

Founder data not yet collected for this app.

Funding

Funding data not yet collected for this app.

Press & Links

Press & Links data not yet collected for this app.

Contacts & Socials

Contacts & Socials data not yet collected for this app.
📈Ratings growth84,597 ratings+61% lifetimeShow 3-year history estimate ▾Jun 2023Jan 2025Jun 2026
Tracked (1 weeks) Pre-tracking estimate (37 weeks) · model-based, ±5% noise · anchored to release date and current value
Profile is built from iTunes Lookup + developer site scrape + ML revenue model. Empty fields show "Not found" — additional sources (Crunchbase, X, IndieHackers, Acquire.com) coming.

📝 About this app

✏️ Looking for a simple and effective budget planner? Meet the simplest Expense Tracker – your all-in-one money manager designed to help you track spending, save money, and take control of your personal finance.

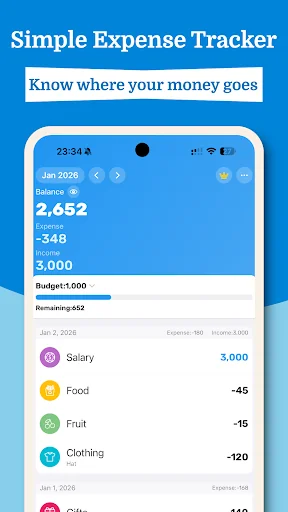
✏️ Stop wondering where your money goes. Whether you want to pay off debt, build an emergency fund, or simply manage your daily budget, Expense Tracker makes specific financial goals achievable. It’s more than just a spending tracker; it’s your path to financial freedom!

✨ Key Features of Expense Tracker

📊 1.… View full description on the official store →
App Specs
🔐 Own this app? Claim & verify MRR →
🔖 v3.0.31🔄 updated 0d ago📂 Finance💰 Free📺 Ad-supported💎 IAP $0.99 - $13.99 per item
🔔

Track this app’s revenue

FREE
Get an email when revenue moves by your threshold. No spam, unsubscribe in one click.

📝 Description

95
BU Score · Transcendent
Full revenue analysis
Read the article-style breakdown for Expense Tracker: EasyBudget: category rank, percentile, growth signal, comparable apps, and how the forecast is calibrated against verified-MRR anchors in this niche.
Read deep-dive →

Similar apps in Finance

About this analysis
ZCAnalyzed by Zakhar Chumak · founder, bumetric·Full methodology·High confidence

Why high confidence: 84,597 ratings · no founder-verified revenue (model estimate only).

Frequently Asked Questions

4 answers · auto-generated from this app's public data
How much does Expense Tracker make per month?
Based on our ML-calibrated revenue forecast, Expense Tracker earns approximately $1.3K/mo. This is a US-storefront-equivalent estimate; global revenue can be several times larger for internationally-distributed apps. See the methodology page for the full formula and confidence bands.
What apps are like Expense Tracker?
Browse the full Finance category catalog to find similar apps with revenue, build cost, audience and tech stack data. Each /p/{slug} page also shows a Compare side-by-side widget with three peer apps from the same niche.
Who makes Expense Tracker?
Expense Tracker is published by TinyCraft on the Google Play Store. See the full publisher portfolio (other apps by the same developer) via the More by developer block on the product page above.
What is Expense Tracker's BU Score?
Expense Tracker has a BU Score of 77/100 (Strong). The score combines App Store rating, ratings count, monetization model and revenue signals calibrated against founder-verified MRR anchors. See the BU Score formula.