7-Eleven
 60
60


7-Eleven
7-Eleven is an Android app from 7-Eleven Danmark in the Food & Drink category, currently rated 4.4★ across 1,695 ratings. Initial signal reads as mostly critical sentiment so far: users flag rough edges and unmet expectations.
Quality Score is 60: Solid (established niche player). For a Food & Drink app, that means established niche player. The full BU Investment Matrix below scores 8 dimensions including monetisation, growth, and operational risk.
Track changes month-over-month in the Performance section below: live snapshot history and revenue forecast included.
- Title & subtitle keyword fit
- Description hook & conversion structure
- Screenshots, ratings, reviews strategy
📊 Performance Tracking LIVE
Synthetic estimate. Inputs: category complexity, file size, screen count, monetization layer, platform reach, age × team-size proxy. Calibrated against 2024-2026 indie-agency rate surveys. Full math + source list on /methodology.
| 🧱 MVP baseline (design + 1-store ship) | +$28K |
| 📱 5 unique screens × $4.5K | +$22K |
| ⚙ Food & Drink complexity ×1.10 | +$5K |
| 🌐 Cross-platform reach (iOS + Android) | +$30K |
Synthetic estimate. Multiple band derived from ad-supported + age, rating quality, category demand, and user-base maturity. Calibrated against 2024-2026 indie-app-marketplace closed-deal medians. Full math + comparable deal list on /methodology.
| 📺 Ad-supported base | 15× MRR |
| ⭐ ★ rating ≥ 4.4 (solid) | +8% |
Synthetic estimate from ratings × category benchmarks. Calibrated against 2024-2026 mobile-attribution retention + DAU/MAU reports. Numbers are US-storefront-equivalent — true global audience can be 5-10× larger for international apps. Full math + source list on /methodology.
| 📲 Food & Drink engagement | ~100 installs / rating |
| 🔁 Food & Drink D30 retention | 14% |
| 📍 DAU / MAU stickiness | 0.20 |
How we forecast this revenue
LOW CONFIDENCEBU Investment Matrix
Early-stage solo · 44/100INDIE TIERexpected for tier- 💰 Revenue: Marginal — $215 - $1348/mo · INDIE tier · medium confidence, trajectory unclear.
- ⭐ Quality: 4.42★ across 1,695 reviews — strong (top 10%).
- 📍 Market: Not yet charting in any of the 9 monitored markets.
- 📈 Growth: Insufficient signal to assess trajectory.
- ⚠️ Risk: Low — no material risk signals detected.
💰 Forecast Revenue / mo
MODEL| Low install base (1,695 ratings)METRIC | +$1,500 | |
| Mature app (10y old)METRIC | +$1,500 | |
| Good rating (4.4★)METRIC | +$800 | |
| Ad-supported / freemiumMETRIC | +$600 |
📈 Reviews Growth
LIVE⭐ Rating Trend
LIVEProfile & Insights
Identification
- App name
- 7-Eleven
- Developer
- 7-Eleven Danmark
- Bundle ID
- dk.releaze.seveneleven
- App Store URL
- Open in App Store
- Category
- Food & Drink
- Content rating
- Not found
- Languages
- Not found
Company
- Website
- www.7-eleven.dk
- Tagline
- Not found
- Description
- Not found
- Founded
- Not found
- HQ / Address
- Not found
- Employees
- Not found
- Logo
- Not found
Revenue
- Verified revenue / mo
- Not found
- AI revenue estimate / mo
- Not found
- AI annual estimate
- Not found
- ML model estimate / mo
- $539/mo
- Top-grossing rank
- Not found
- All-time revenue
- Not found
- Pricing
- Not found
Founder
Funding
Press & Links
Contacts & Socials
📈Ratings growth1,695 ratings+18% lifetimeShow 3-year history estimate ▾
📝 About this app
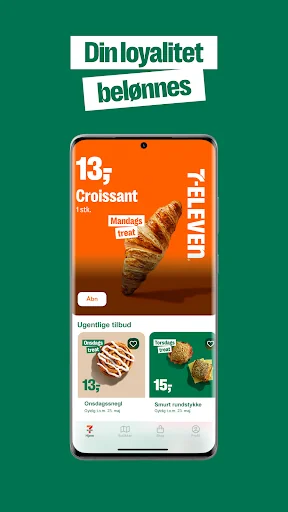
OFFER:
Here you will find new app offers every week on e.g. tasty food, mouth-watering drinks and fragrant products from the bakery. Check your app regularly and redeem your code in the store when, for example your favorite product is on sale.… View full description on the official store →
Tech & Domain Intel — 7-eleven.dk
- Mail provider
- Microsoft 365
- Tech stack
- Google Workspace · Apple Pay / Sign in with Apple · SendGrid
Track this app’s revenue
FREE📝 Description
95


Why medium confidence: 1,695 ratings · no founder-verified revenue (model estimate only).