29K iOS Apps Tracked Updated 2 min ago Revenue Forecasts
Add an app Create Account Sign In
Home

Common App

45
Quality Score
Emerging

Common App

Medium confidence
3.1 ✍️ Editor
✍️ bumetric analysis

Common App is an iOS app from The Common Application in the News category, currently rated 3.1★ across 646 ratings. Initial signal reads as mostly critical sentiment so far: users flag rough edges and unmet expectations.

Quality Score is 45: Emerging (early traction worth watching). For a News app, that means early traction worth watching. The full BU Investment Matrix below scores 8 dimensions including monetisation, growth, and operational risk.

Track changes month-over-month in the Performance section below: live snapshot history and revenue forecast included.

💰 Monthly revenue · now vs forecast
● Right now
$5.0K
per month
12-mo forecast
$5.2K – $10.8K
per month
24-mo forecast
$6.4K – $19.2K
per month
MID tier
💡 Grow this revenue
Free AI audit of this app’s store listing
  • Title & subtitle keyword fit
  • Description hook & conversion structure
  • Screenshots, ratings, reviews strategy
Run free AI audit →
Typical impact: +2-5× organic installs
🔔Notify me when this app's revenue changes by

📊 Performance Tracking LIVE

Loading…
idle
0%
Rating
Reviews
Forecast Revenue / mo
Snapshots tracked
0
since first record
ONE-TIME · BUILD 💰 Estimated build cost
$60K
What it cost to build · not monthly revenue
Likely range $45K – $80K
$25K · MVP floor $100K · indie scale $500K+ · studio build
📈 Slow ROI — current MRR is well below build cost

Synthetic estimate. Inputs: category complexity, file size, screen count, monetization layer, platform reach, age × team-size proxy. Calibrated against 2024-2026 indie-agency rate surveys. Full math + source list on /methodology.

Where the money goes
🧱 MVP baseline (design + 1-store ship) +$28K
📱 5 unique screens × $4.5K +$22K
News complexity ×1.20 +$10K
Total estimate $60K
👥 Estimated audience size
77K
Lifetime downloads (US-equivalent)
Monthly active
11K
Daily active
5.1K

Synthetic estimate from ratings × category benchmarks. Calibrated against 2024-2026 mobile-attribution retention + DAU/MAU reports. Numbers are US-storefront-equivalent — true global audience can be 5-10× larger for international apps. Full math + source list on /methodology.

How we sized it
📲 News engagement ~120 installs / rating
🔁 News D30 retention 15%
📍 DAU / MAU stickiness 0.45
DAU / MAU 44% sticky
🔬

How we forecast this revenue

MEDIUM CONFIDENCE
Baseline
$5.0K/mo · ML-estimated from 234 triggers
Growth rate
+4.0% MoM · MID tier baseline (compound monthly)
6 months
$4.7K – $7.9K
12 months
$5.2K – $10.8K
24 months
$6.4K – $19.2K
Compound growth at +4.0% MoM (tier baseline for MID). Range widens with horizon — typical noise band ±25% at 6mo.. Ranges widen with horizon — distant futures carry more uncertainty.
📊

BU Investment Matrix

Stalled · 39/100MID TIERno growth momentum
GrowthFounderQualityRevenueMonetiz.MoatMarketSafety
Growth Velocity
5.0
Founder Strength
3.7
Product Quality
4.3
Revenue Strength
3.7
Monetization Maturity
1.0
Defensibility
4.9
Market Position
1.8
Operational Safety
7.0
  • 💰 Revenue: Modest — $3K - $7K/mo · MID tier · medium confidence, trajectory unclear.
  • ⭐ Quality: 3.1★ across 646 reviews — weak — significant quality concerns.
  • 📍 Market: Not yet charting in any of the 9 monitored markets.
  • 📈 Growth: last update 257d ago — slow cadence.
  • ⚠️ Risk: Moderate — no material risk signals detected.
🎯 For competitors: Mixed picture. Worth competing if you have a clear UX or pricing edge — otherwise crowded segment.
💵 For acquirers: Estimated asking range 18-32× monthly = $90K-$160K.
Composite of 8 dimensions computed deterministically from public signals — no LLM, every score traces back to a measurable input. Default weights shown; "compete" / "acquire" / "invest" lenses re-weight without re-fetching.
Range:

💰 Forecast Revenue / mo

MODEL
Revenue forecast computed from BU's 234 trigger model on each snapshot. Calibrated against ground-truth from 58 verified-revenue apps.
🔬Forecast Breakdown — Why This Estimate?Top 7 of 7 triggers
Our ML model uses 200+ signals from public data. These are the most influential for this app:
bugsREVIEW
−$1,800
5 starREVIEW
+$1,800
Below-average rating (3.1★)METRIC
−$1,500
Established app (5y old)METRIC
+$800
Ad-supported / freemiumMETRIC
+$600
Early-stage install base (646 ratings)METRIC
+$400
Single-language (English only)METRIC
−$400
METRIC = structural app data · REVIEW = mined from user reviews · ✓ VERIFIED = Stripe-verified anchor (TrustMRR)

📈 Reviews Growth

LIVE
Cumulative review count from first BU snapshot. Each point = a tracked update.

⭐ Rating Trend

LIVE
Average rating evolution. Updates with each new review batch.

🆕 What's New · v2.3

A small maintenance release to keep things humming along smoothly.

Profile & Insights

Everything we know — and don't — about this app and its company.

Identification

App name
Common App
Developer
The Common Application
Bundle ID
org.commonapp.apply
App Store URL
Open in App Store
Category
News
Content rating
12+
Languages
EN

Company

Website
Not found
Tagline
Your future starts here
Description
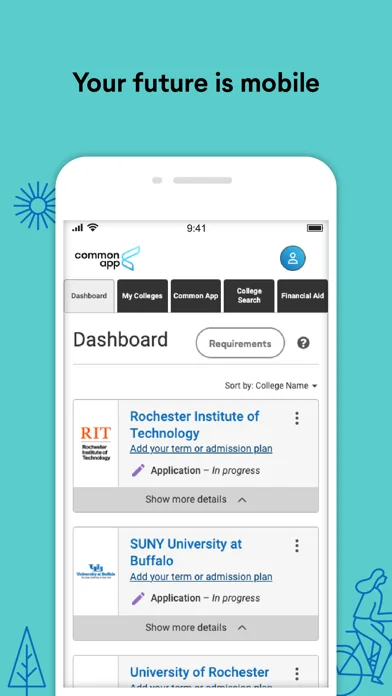
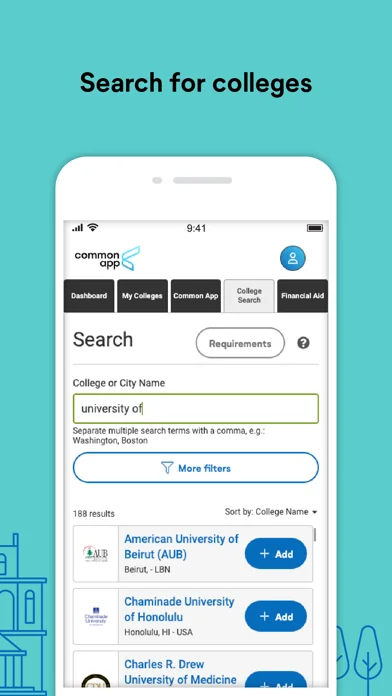
Common App streamlines college applications for over 1,000 schools, saving time, tracking deadlines, and supporting students, counselors, and recommenders.
Founded
Not found
HQ / Address
Not found
Employees
Not found
Logo
Available

Revenue

Verified revenue / mo
Not found
AI revenue estimate / mo
Not found
AI annual estimate
Not found
ML model estimate / mo
$201/mo
Top-grossing rank
Outside top 100 in US News
All-time revenue
Not found
Pricing
Not found

Founder

Name
Not found
X / Twitter
twitter.com/CommonApp
LinkedIn
linkedin.com/company/the-common-appli…
GitHub
Not found
X followers
Not found
Public statements
Not found

Funding

Funding data not yet collected for this app.

Press & Links

Press & Links data not yet collected for this app.

Contacts & Socials

Socials
facebook facebook.com/commonapp · instagram instagram.com/commonapp · linkedin linkedin.com/company/the-common-appli… · twitter twitter.com/CommonApp · youtube youtube.com/user/CommonAppMedia
Email
Not found
Phone
Not found
Contact page
commonapp.org/help
About page
commonapp.org/about/reports-and-insights
📈Ratings growth646 ratings+797% lifetimeShow 3-year history estimate ▾Oct 2022Sep 2024Jun 2026
Tracked (52 weeks) Pre-tracking estimate (36 weeks) · model-based, ±5% noise · anchored to release date and current value
🌍Geographic ReachNot ranked
This app is currently outside the top 100 grossing in all 9 countries we monitor (US, UK, DE, FR, JP, CA, AU, BR, IN). Niche or new apps often launch this way — popularity rankings appear once daily revenue clears the regional threshold.
Profile is built from iTunes Lookup + developer site scrape + ML revenue model. Empty fields show "Not found" — additional sources (Crunchbase, X, IndieHackers, Acquire.com) coming.

📝 About this app

Simplify your college application experience with Common App for mobile.

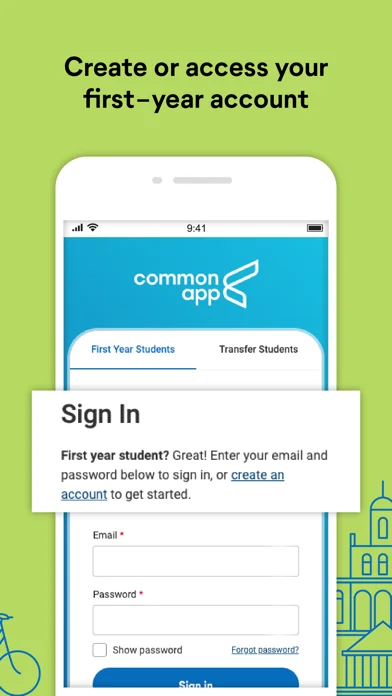
Common App for mobile provides you with the same secure, streamlined application experience you’ve come to expect from Common App online, all from the convenience of your mobile device. The app seamlessly integrates with the first-year desktop experience — allowing you to apply to more than 1000 colleges, research financial aid, and get advice from counselors.

Common App for mobile is free and easy to use. Download the app to navigate your entire college application journey.
App Specs
🔐 Own this app? Claim & verify MRR →
💾 15 MB🔞 12+📱 iOS 14.0+🔖 v2.3🔄 updated 0d ago🌐 EN📂 News💰 Paid
📅

What Worked™ · Development Pipeline

8 EVENTS TRACKED
Detected changes in this app over its tracked lifetime — each event links cause (what changed) to effect (what moved). Sorted newest first.See full history →Version history →
2026-05
🔄
Monetization changed: freemium → free
2026-03
Rating ↑ 2.49 → 3.10 (improved 0.61★)
2026-03
📈
Crossed 500 ratings — social-proof flywheel kicking in
2024-08
📈
Crossed 100 ratings — social-proof flywheel kicking in
2021-01
📈
Crossed 50 ratings — social-proof flywheel kicking in
2020-11
🚀
First tracked snapshot — initial data captured
2020-11
Rating ↓ 5.00 → 4.60 (dropped 0.40★)
2020-11
📈
Crossed 10 ratings — social-proof flywheel kicking in
🌍

Multi-Country Performance

Available in 6 of 9 monitored markets
MarketRatingReviewsCurrent version
🇦🇺 AU3★23★ this version
🇫🇷 FR0★0
🇬🇧 GB3.5★163.5★ this version
🇮🇳 IN3.78947★193.78947★ this version
🇯🇵 JP3★23★ this version
🇺🇸 US3.09077★6503.09077★ this version
🔔

Track this app’s revenue

FREE
Get an email when revenue moves by your threshold. No spam, unsubscribe in one click.

📝 Description

95
BU Score · Transcendent
Full revenue analysis
Read the article-style breakdown for Common App: category rank, percentile, growth signal, comparable apps, and how the forecast is calibrated against verified-MRR anchors in this niche.
Read deep-dive →

More by The Common Application

View all →
📦 Portfolio summaryINDIE studio
2apps·$473/mocombined
Lead-app heavy — top app contributes 58%

Similar apps in News

About this analysis
ZCAnalyzed by Zakhar Chumak · founder, bumetric·Full methodology·Medium confidence

Why medium confidence: 646 ratings · no founder-verified revenue (model estimate only).

Frequently Asked Questions

4 answers · auto-generated from this app's public data
How much does Common App make per month?
Based on our ML-calibrated revenue forecast, Common App earns approximately $200/mo. This is a US-storefront-equivalent estimate; global revenue can be several times larger for internationally-distributed apps. See the methodology page for the full formula and confidence bands.
What apps are like Common App?
Browse the full News category catalog to find similar apps with revenue, build cost, audience and tech stack data. Each /p/{slug} page also shows a Compare side-by-side widget with three peer apps from the same niche.
Who makes Common App?
Common App is published by The Common Application on the Apple App Store. See the full publisher portfolio (other apps by the same developer) via the More by developer block on the product page above.
What is Common App's BU Score?
Common App has a BU Score of 45/100 (Emerging). The score combines App Store rating, ratings count, monetization model and revenue signals calibrated against founder-verified MRR anchors. See the BU Score formula.