29K iOS Apps Tracked Updated 4 min ago Revenue Forecasts
Add an app Create Account Sign In
Home

Disneyland®

84
Quality Score
Excellent

Disneyland®

High confidence
4.7 ✍️ Editor
✍️ bumetric analysis

This app dominates the hyper-specific niche of theme park navigation and experience enhancement for Disneyland Resort visitors, directly competing with physical park maps, third-party unofficial guides, and the inherent friction of unassisted park exploration. The exceptionally high user satisfaction, evidenced by millions of positive ratings, signals mature, sustained traction and a firmly established market position, well beyond initial growth stages. For freemium apps in the travel and experience category, a common monetization observation is the strong correlation between in-app purchases for premium features – like expedited ride access or exclusive content – and increased overall visitor spending within the physical location. The app acts as a powerful upsell channel, leveraging convenience and perceived value to drive revenue both digitally and on-site.

BU Score 84 · Excellent — strong product-market fit. The full Investment Matrix below scores 8 dimensions including monetisation, growth, and operational risk.

Track snapshot history and revenue forecast in the Performance section below.

💰 Monthly revenue · now vs forecast
● Right now
$12.0M
per month
12-mo forecast
$12.3M – $16.4M
per month
24-mo forecast
$13.7M – $20.6M
per month
MEGA tier
💡 Grow this revenue
Free AI audit of this app’s store listing
  • Title & subtitle keyword fit
  • Description hook & conversion structure
  • Screenshots, ratings, reviews strategy
Run free AI audit →
Typical impact: +2-5× organic installs
🔔Notify me when this app's revenue changes by

📊 Performance Tracking LIVE

Loading…
idle
0%
Rating
Reviews
Forecast Revenue / mo
Snapshots tracked
0
since first record
ONE-TIME · BUILD 💰 Estimated build cost
$120K
What it cost to build · not monthly revenue
Likely range $90K – $160K
$25K · MVP floor $100K · indie scale $500K+ · studio build
📈 Pays back in ~1.8y at current MRR

Synthetic estimate. Inputs: category complexity, file size, screen count, monetization layer, platform reach, age × team-size proxy. Calibrated against 2024-2026 indie-agency rate surveys. Full math + source list on /methodology.

Where the money goes
🧱 MVP baseline (design + 1-store ship) +$28K
📱 5 unique screens × $4.5K +$22K
📦 Asset bundle (489 MB) +$40K
Travel complexity ×1.30 +$27K
Total estimate $120K
ONE-TIME · EXIT VALUE 💵 Estimated acquisition value
$100K
What it would sell for · not monthly revenue
Marketplace range $75K – $125K · 19× MRR multiple
💸 ~0.8× build cost (under-water)

Synthetic estimate. Multiple band derived from ad-supported + age, rating quality, category demand, and user-base maturity. Calibrated against 2024-2026 indie-app-marketplace closed-deal medians. Full math + comparable deal list on /methodology.

How the multiple was built
📺 Ad-supported base 15× MRR
★ rating ≥ 4.7 (premium) +15%
Mature user base (1M+ ratings) +8%
Final multiple 19× MRR
👥 Estimated audience size
197.0M
Lifetime downloads (US-equivalent)
Monthly active
19.5M
Daily active
2.9M

Synthetic estimate from ratings × category benchmarks. Calibrated against 2024-2026 mobile-attribution retention + DAU/MAU reports. Numbers are US-storefront-equivalent — true global audience can be 5-10× larger for international apps. Full math + source list on /methodology.

How we sized it
📲 Travel engagement ~110 installs / rating
🔁 Travel D30 retention 10%
📍 DAU / MAU stickiness 0.15
DAU / MAU 15% sticky
🔬

How we forecast this revenue

MEDIUM CONFIDENCE
Baseline
$12.0M/mo · ML-estimated from 234 triggers
Growth rate
+1.5% MoM · MEGA tier baseline (compound monthly)
6 months
$11.8M – $14.4M
12 months
$12.3M – $16.4M
24 months
$13.7M – $20.6M
Compound growth at +1.5% MoM (tier baseline for MEGA). Range widens with horizon — typical noise band ±10% at 6mo.. Ranges widen with horizon — distant futures carry more uncertainty.
📊

BU Investment Matrix

Mixed signals · 62/100MEGA TIERcompetitive but cautious
GrowthFounderQualityRevenueMonetiz.MoatMarketSafety
Growth Velocity
5.0
Founder Strength
7.8
Product Quality
9.5
Revenue Strength
7.1
Monetization Maturity
1.0
Defensibility
7.5
Market Position
2.0
Operational Safety
10.0
  • 💰 Revenue: Strong — $4.8M - $24.0M/mo · MEGA tier · low confidence, trajectory unclear.
  • ⭐ Quality: 4.74★ across 1,793,368 reviews — exceptional (top 1% in category).
  • 📍 Market: Not yet charting in any of the 9 monitored markets.
  • 📈 Growth: Insufficient signal to assess trajectory.
  • ⚠️ Risk: Low — no material risk signals detected.
🎯 For competitors: Mixed picture. Worth competing if you have a clear UX or pricing edge — otherwise crowded segment.
💵 For acquirers: Estimated asking range 32-48× monthly = $384.0M-$576.0M.
Composite of 8 dimensions computed deterministically from public signals — no LLM, every score traces back to a measurable input. Default weights shown; "compete" / "acquire" / "invest" lenses re-weight without re-fetching.
Range:

💰 Forecast Revenue / mo

MODEL
Revenue forecast computed from BU's 234 trigger model on each snapshot. Calibrated against ground-truth from 58 verified-revenue apps.
🔬Forecast Breakdown — Why This Estimate?Top 10 of 10 triggers
Our ML model uses 200+ signals from public data. These are the most influential for this app:
High install base (1,793,368 ratings)METRIC
+$12,000
Excellent rating (4.7★)METRIC
+$2,200
bugsREVIEW
−$1,800
5 starREVIEW
+$1,800
cancelledREVIEW
−$1,500
Mature app (10y old)METRIC
+$1,500
slowREVIEW
−$1,200
too expensiveREVIEW
−$1,000
Ad-supported / freemiumMETRIC
+$600
Single-language (English only)METRIC
−$400
METRIC = structural app data · REVIEW = mined from user reviews · ✓ VERIFIED = Stripe-verified anchor (TrustMRR)

📈 Reviews Growth

LIVE
Cumulative review count from first BU snapshot. Each point = a tracked update.

⭐ Rating Trend

LIVE
Average rating evolution. Updates with each new review batch.

🆕 What's New · v8.21.1

We’ve added new details about events, entertainment and more—to help you plan your Disneyland Resort visit. Plus, we’ve improved overall app performance.

Profile & Insights

Everything we know — and don't — about this app and its company.

Identification

App name
Disneyland®
Developer
Disney
Bundle ID
com.disney.DLR
App Store URL
Open in App Store
Category
Travel
Content rating
4+
Languages
EN

Company

Website
disneyland.disney.go.com
Tagline
Disneyland Resort in Anaheim, California – Official Site
Description
The Disneyland Resort in California is the Happiest Place on Earth. Enjoy 2 incredible theme parks, meet favorite characters and ride thrilling attractions.
Founded
Not found
HQ / Address
Not found
Employees
Not found
Logo
Available

Revenue

Verified revenue / mo
Not found
AI revenue estimate / mo
$100.0K ($56.0K – $140.0K)AI medium
AI annual estimate
$1.2M/yr
ML model estimate / mo
$5.4K/mo
Top-grossing rank
🇯🇵#9 /100   🇺🇸#11 /100   🇨🇦#43 /100   🇬🇧#89 /99
All-time revenue
Not found
Pricing
Not found

Founder

Founder data not yet collected for this app.

Funding

Funding data not yet collected for this app.

Press & Links

Press & Links data not yet collected for this app.

Contacts & Socials

Contacts & Socials data not yet collected for this app.
AI Revenue EstimateCONFIDENCE: MEDIUM
The iOS app "Disneyland®" by Disney is estimated to generate approximately $100,000 in monthly revenue, with a likely range between $56,000 and $140,000. This translates to an estimated annual revenue of $1.2 million.
Sources mentioned: Sensor Tower
📈Ratings growth1,793,368 ratings+53% lifetimeShow 3-year history estimate ▾
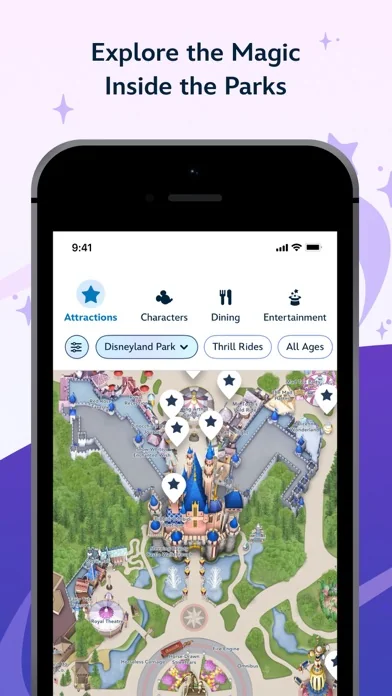
Jun 2023Oct 2025Jun 2026
Tracked (21 weeks) Pre-tracking estimate (36 weeks) · model-based, ±5% noise · anchored to release date and current value
🌍Top Countries — Grossing Rank4 countries
🇯🇵JP
#9 /100
🇺🇸US
#11 /100
🇨🇦CA
#43 /100
🇬🇧GB
#89 /99
📊Category Rank Trajectory#9 now · best #8 · worst #100
Lower line = better rank · Estimate from ratings growth model · Lower position on chart = worse rank · Higher = top of chart
Profile is built from iTunes Lookup + developer site scrape + ML revenue model. Empty fields show "Not found" — additional sources (Crunchbase, X, IndieHackers, Acquire.com) coming.

📝 About this app

Download the official app for the Disneyland® Resort! Enhance your next visit with an enchanting mobile experience. Buy your tickets, use the complimentary Disney Genie service planning tool, browse maps, locate Disney Characters appearing throughout the parks and much more!

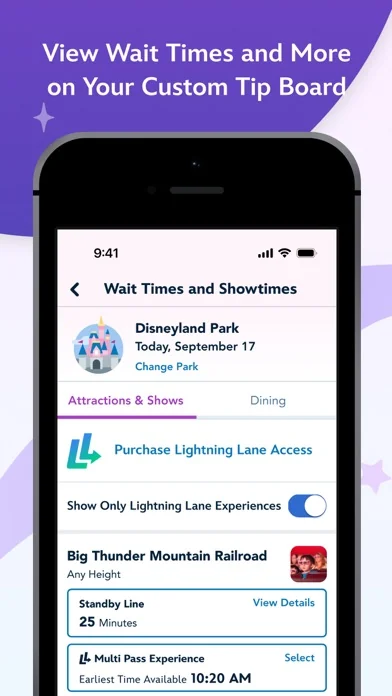
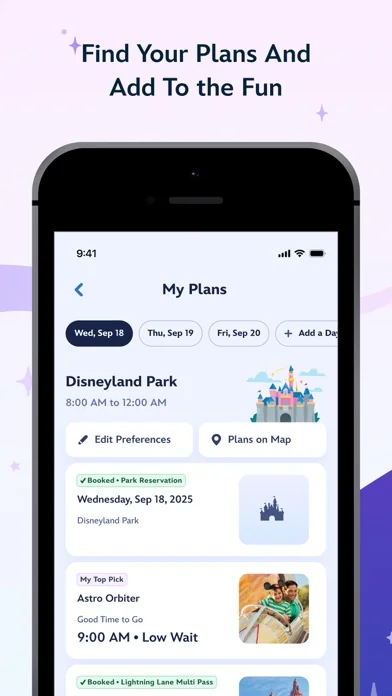
Make your theme park visit easier and more fun by taking advantage of our complimentary new Disney Genie service, which grants you a personalized itinerary that seamlessly maps out your special day with updates that continue during your visit.… View full description on the official store →
App Specs
🔐 Own this app? Claim & verify MRR →
💾 489 MB🔞 4+📱 iOS 17.0+🔖 v8.21.1🔄 updated 0d ago🌐 EN📂 Travel💰 Free
📅

What Worked™ · Development Pipeline

8 EVENTS TRACKED
Detected changes in this app over its tracked lifetime — each event links cause (what changed) to effect (what moved). Sorted newest first.See full history →Version history →
2026-05
🔄
Monetization changed: freemium → free
2026-03
📈
Crossed 500 ratings — social-proof flywheel kicking in
2026-03
Rating ↑ 2.76 → 4.50 (improved 1.74★)
2025-10
📈
Crossed 100 ratings — social-proof flywheel kicking in
2025-09
📈
Crossed 50 ratings — social-proof flywheel kicking in
2025-08
📈
Crossed 10 ratings — social-proof flywheel kicking in
2025-08
🚀
First tracked snapshot — initial data captured
2025-08
Rating ↓ 5.00 → 3.00 (dropped 2.00★)
🌍

Multi-Country Performance

Available in 9 of 9 monitored markets
MarketRatingReviewsCurrent version
🇦🇺 AU4.62011★24,2234.62011★ this version
🇧🇷 BR4.75718★10,4244.75718★ this version
🇨🇦 CA4.61489★59,4584.61489★ this version
🇩🇪 DE4.33349★2,0634.33349★ this version
🇫🇷 FR4.57426★1,8184.57426★ this version
🇬🇧 GB4.50532★10,9934.50532★ this version
🇮🇳 IN4.64222★1,8284.64222★ this version
🇯🇵 JP4.7082★12,5604.7082★ this version
🇺🇸 US4.73918★1,804,7854.73918★ this version
🔔

Track this app’s revenue

FREE
Get an email when revenue moves by your threshold. No spam, unsubscribe in one click.

📝 Description

95
BU Score · Transcendent
Full revenue analysis
Read the article-style breakdown for Disneyland®: category rank, percentile, growth signal, comparable apps, and how the forecast is calibrated against verified-MRR anchors in this niche.
Read deep-dive →

More by Disney

View all →
📦 Portfolio summaryMID studio
64apps·$194K/mocombined
✓ Diversified — top app contributes 21%; risk spread across portfolio

Similar apps in Travel

About this analysis
ZCAnalyzed by Zakhar Chumak · founder, bumetric·Full methodology·High confidence

Why high confidence: 1,793,368 ratings · no founder-verified revenue (model estimate only).

Frequently Asked Questions

4 answers · auto-generated from this app's public data
How much does Disneyland® make per month?
Based on our ML-calibrated revenue forecast, Disneyland® earns approximately $5.4K/mo. This is a US-storefront-equivalent estimate; global revenue can be several times larger for internationally-distributed apps. See the methodology page for the full formula and confidence bands.
What apps are like Disneyland®?
Browse the full Travel category catalog to find similar apps with revenue, build cost, audience and tech stack data. Each /p/{slug} page also shows a Compare side-by-side widget with three peer apps from the same niche.
Who makes Disneyland®?
Disneyland® is published by Disney on the Apple App Store. See the full publisher portfolio (other apps by the same developer) via the More by developer block on the product page above.
What is Disneyland®'s BU Score?
Disneyland® has a BU Score of 84/100 (Excellent). The score combines App Store rating, ratings count, monetization model and revenue signals calibrated against founder-verified MRR anchors. See the BU Score formula.