29K iOS Apps Tracked Updated just now Revenue Forecasts
Add an app Create Account Sign In
Home

mySolarEdge

72
Quality Score
Strong

mySolarEdge

High confidence
4.5 ✍️ Editor
✍️ bumetric analysis

mySolarEdge is an iOS app from SolarEdge Technologies in the Utilities category, currently rated 4.5★ across 18,774 ratings. Initial signal reads as mostly critical sentiment so far: users flag rough edges and unmet expectations.

Quality Score is 72: Strong (healthy traction). For a Utilities app, that means healthy traction. The full BU Investment Matrix below scores 8 dimensions including monetisation, growth, and operational risk.

Track changes month-over-month in the Performance section below: live snapshot history and revenue forecast included.

💰 Monthly revenue · now vs forecast
● Right now
$600K
per month
12-mo forecast
$635K – $978K
per month
24-mo forecast
$759K – $1410K
per month
BIG tier
💡 Grow this revenue
Free AI audit of this app’s store listing
  • Title & subtitle keyword fit
  • Description hook & conversion structure
  • Screenshots, ratings, reviews strategy
Run free AI audit →
Typical impact: +2-5× organic installs
🔔Notify me when this app's revenue changes by

📊 Performance Tracking LIVE

Loading…
idle
0%
Rating
Reviews
Forecast Revenue / mo
Snapshots tracked
0
since first record
ONE-TIME · BUILD 💰 Estimated build cost
$65K
What it cost to build · not monthly revenue
Likely range $50K – $90K
$25K · MVP floor $100K · indie scale $500K+ · studio build
📈 Pays back in ~9 months at current MRR

Synthetic estimate. Inputs: category complexity, file size, screen count, monetization layer, platform reach, age × team-size proxy. Calibrated against 2024-2026 indie-agency rate surveys. Full math + source list on /methodology.

Where the money goes
🧱 MVP baseline (design + 1-store ship) +$28K
📱 5 unique screens × $4.5K +$22K
📦 Asset bundle (114 MB) +$25K
Utilities complexity ×0.85 $-11405
Total estimate $65K
ONE-TIME · EXIT VALUE 💵 Estimated acquisition value
$100K
What it would sell for · not monthly revenue
Marketplace range $75K – $125K · 15× MRR multiple
💸 ~1.5× build cost (break-even+)

Synthetic estimate. Multiple band derived from ad-supported + age, rating quality, category demand, and user-base maturity. Calibrated against 2024-2026 indie-app-marketplace closed-deal medians. Full math + comparable deal list on /methodology.

How the multiple was built
📺 Ad-supported base 15× MRR
★ rating ≥ 4.4 (solid) +8%
🏷 Utilities category multiple -10%
Final multiple 15× MRR
👥 Estimated audience size
3.8M
Lifetime downloads (US-equivalent)
Monthly active
750K
Daily active
150K

Synthetic estimate from ratings × category benchmarks. Calibrated against 2024-2026 mobile-attribution retention + DAU/MAU reports. Numbers are US-storefront-equivalent — true global audience can be 5-10× larger for international apps. Full math + source list on /methodology.

How we sized it
📲 Utilities engagement ~200 installs / rating
🔁 Utilities D30 retention 20%
📍 DAU / MAU stickiness 0.20
DAU / MAU 20% sticky
🔬

How we forecast this revenue

MEDIUM CONFIDENCE
Baseline
$600K/mo · ML-estimated from 234 triggers
Growth rate
+2.5% MoM · BIG tier baseline (compound monthly)
6 months
$591K – $800K
12 months
$635K – $978K
24 months
$759K – $1.4M
Compound growth at +2.5% MoM (tier baseline for BIG). Range widens with horizon — typical noise band ±15% at 6mo.. Ranges widen with horizon — distant futures carry more uncertainty.
📊

BU Investment Matrix

Mixed signals · 57/100BIG TIERcompetitive but cautious
GrowthFounderQualityRevenueMonetiz.MoatMarketSafety
Growth Velocity
5.0
Founder Strength
6.6
Product Quality
9.1
Revenue Strength
5.8
Monetization Maturity
1.0
Defensibility
6.5
Market Position
2.0
Operational Safety
10.0
  • 💰 Revenue: Healthy — $240K - $1320K/mo · BIG tier · medium-low confidence, trajectory unclear.
  • ⭐ Quality: 4.55★ across 18,774 reviews — exceptional (top 1% in category).
  • 📍 Market: Not yet charting in any of the 9 monitored markets.
  • 📈 Growth: Insufficient signal to assess trajectory.
  • ⚠️ Risk: Low — no material risk signals detected.
🎯 For competitors: Mixed picture. Worth competing if you have a clear UX or pricing edge — otherwise crowded segment.
💵 For acquirers: Estimated asking range 18-32× monthly = $10.8M-$19.2M.
Composite of 8 dimensions computed deterministically from public signals — no LLM, every score traces back to a measurable input. Default weights shown; "compete" / "acquire" / "invest" lenses re-weight without re-fetching.
Range:

💰 Forecast Revenue / mo

MODEL
Revenue forecast computed from BU's 234 trigger model on each snapshot. Calibrated against ground-truth from 58 verified-revenue apps.
🔬Forecast Breakdown — Why This Estimate?Top 10 of 10 triggers
Our ML model uses 200+ signals from public data. These are the most influential for this app:
Mid install base (18,774 ratings)METRIC
+$5,500
Excellent rating (4.5★)METRIC
+$2,200
bugsREVIEW
−$1,800
5 starREVIEW
+$1,800
excellent appREVIEW
+$1,500
slowREVIEW
−$1,200
support teamREVIEW
+$900
Established app (6y old)METRIC
+$800
Ad-supported / freemiumMETRIC
+$600
Single-language (English only)METRIC
−$400
METRIC = structural app data · REVIEW = mined from user reviews · ✓ VERIFIED = Stripe-verified anchor (TrustMRR)

📈 Reviews Growth

LIVE
Cumulative review count from first BU snapshot. Each point = a tracked update.

⭐ Rating Trend

LIVE
Average rating evolution. Updates with each new review batch.

🆕 What's New · v3.0.1

New, more secure sign-in experience

Profile & Insights

Everything we know — and don't — about this app and its company.

Identification

App name
mySolarEdge
Developer
SolarEdge Technologies
Bundle ID
SolarEdge.mySolarEdge
App Store URL
Open in App Store
Category
Utilities
Content rating
4+
Languages
EN

Company

Website
Not found
Tagline
Not found
Description
Not found
Founded
Not found
HQ / Address
Not found
Employees
Not found
Logo
Not found

Revenue

Verified revenue / mo
Not found
AI revenue estimate / mo
Not found
AI annual estimate
Not found
ML model estimate / mo
$7.0K/mo
Top-grossing rank
Outside top 100 in US Utilities
All-time revenue
Not found
Pricing
Not found

Founder

Founder data not yet collected for this app.

Funding

Funding data not yet collected for this app.

Press & Links

Press & Links data not yet collected for this app.

Contacts & Socials

Contacts & Socials data not yet collected for this app.
📈Ratings growth18,774 ratings+66% lifetimeShow 3-year history estimate ▾
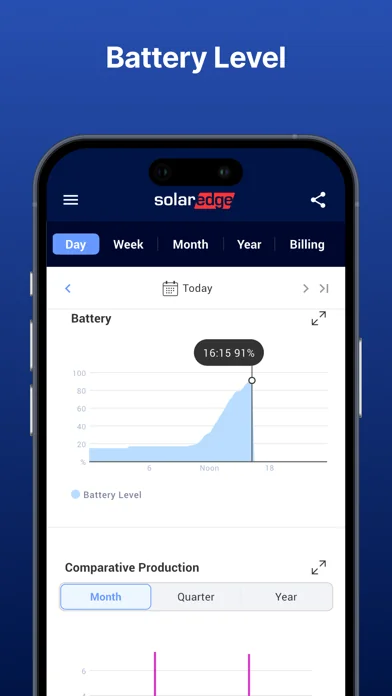
Jun 2023Oct 2025Jun 2026
Tracked (51 weeks) Pre-tracking estimate (36 weeks) · model-based, ±5% noise · anchored to release date and current value
🌍Geographic ReachNot ranked
This app is currently outside the top 100 grossing in all 9 countries we monitor (US, UK, DE, FR, JP, CA, AU, BR, IN). Niche or new apps often launch this way — popularity rankings appear once daily revenue clears the regional threshold.
Profile is built from iTunes Lookup + developer site scrape + ML revenue model. Empty fields show "Not found" — additional sources (Crunchbase, X, IndieHackers, Acquire.com) coming.

📝 About this app

Manage your SolarEdge smart energy devices – anytime, anywhere

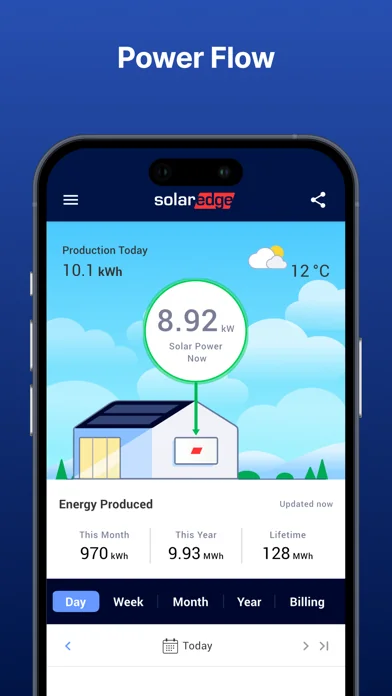
Use mySolarEdge to maximize your SolarEdge experience as well as your electricity savings:
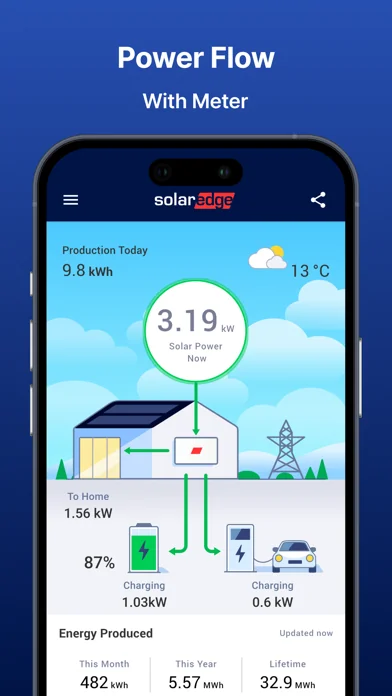
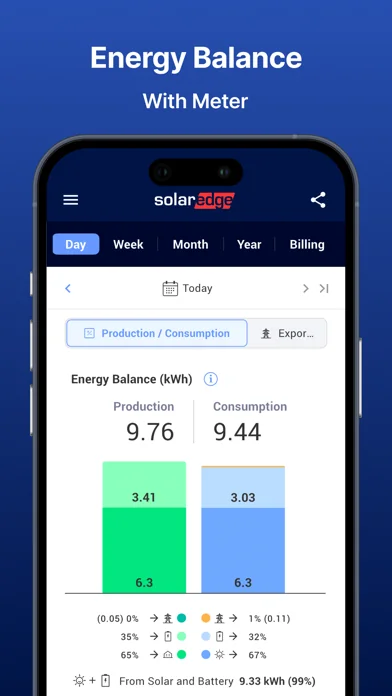
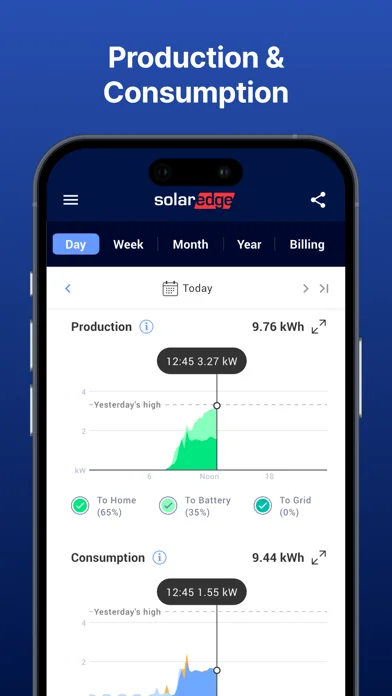
· Track your energy use and production in real-time, with mobile-optimized features
· Identify ways to become more energy efficient
· Control your smart home devices and manage SolarEdge EV charging remotely
· View solar inverter status for quick troubleshooting using step-by-step instructions and easy to read menus in SetApp-enabled inverters only
· Set-up inverter communication and network settings in SetApp-enabled inverters only… View full description on the official store →
App Specs
🔐 Own this app? Claim & verify MRR →
💾 114 MB🔞 4+📱 iOS 14.0+🔖 v3.0.1🔄 updated 0d ago🌐 EN📂 Utilities💰 Paid
📅

What Worked™ · Development Pipeline

12 EVENTS TRACKED
Detected changes in this app over its tracked lifetime — each event links cause (what changed) to effect (what moved). Sorted newest first.See full history →Version history →
2026-05
Rating ↑ 2.31 → 4.55 (improved 2.24★)
2026-05
📈
Crossed 1,000 ratings — social-proof flywheel kicking in
2026-03
📈
Crossed 500 ratings — social-proof flywheel kicking in
2026-03
Rating ↑ 2.32 → 4.50 (improved 2.18★)
2026-03
📈
Crossed 500 ratings — social-proof flywheel kicking in
2021-05
📈
Crossed 100 ratings — social-proof flywheel kicking in
2021-02
📈
Crossed 50 ratings — social-proof flywheel kicking in
2020-12
📈
Crossed 10 ratings — social-proof flywheel kicking in
2020-12
Rating ↑ 3.00 → 3.50 (improved 0.50★)
2020-11
Rating ↓ 4.00 → 3.00 (dropped 1.00★)
2020-11
Rating ↓ 5.00 → 4.00 (dropped 1.00★)
2020-11
🚀
First tracked snapshot — initial data captured
🌍

Multi-Country Performance

Available in 9 of 9 monitored markets
MarketRatingReviewsCurrent version
🇦🇺 AU4.60372★6,7104.60372★ this version
🇧🇷 BR4.72897★2144.72897★ this version
🇨🇦 CA4.60266★5264.60266★ this version
🇩🇪 DE4.45373★10,2334.45373★ this version
🇫🇷 FR4.50033★1,4754.50033★ this version
🇬🇧 GB4.57367★4,2014.57367★ this version
🇮🇳 IN4.42424★334.42424★ this version
🇯🇵 JP4.28571★144.28571★ this version
🇺🇸 US4.54135★18,8034.54135★ this version
🔔

Track this app’s revenue

FREE
Get an email when revenue moves by your threshold. No spam, unsubscribe in one click.

📝 Description

95
BU Score · Transcendent
Full revenue analysis
Read the article-style breakdown for mySolarEdge: category rank, percentile, growth signal, comparable apps, and how the forecast is calibrated against verified-MRR anchors in this niche.
Read deep-dive →

More by SolarEdge Technologies

View all →
📦 Portfolio summaryINDIE studio
6apps·$11K/mocombined
Lead-app heavy — top app contributes 61%

Similar apps in Utilities

About this analysis
ZCAnalyzed by Zakhar Chumak · founder, bumetric·Full methodology·High confidence

Why high confidence: 18,774 ratings · no founder-verified revenue (model estimate only).

Frequently Asked Questions

4 answers · auto-generated from this app's public data
How much does mySolarEdge make per month?
Based on our ML-calibrated revenue forecast, mySolarEdge earns approximately $7.0K/mo. This is a US-storefront-equivalent estimate; global revenue can be several times larger for internationally-distributed apps. See the methodology page for the full formula and confidence bands.
What apps are like mySolarEdge?
Browse the full Utilities category catalog to find similar apps with revenue, build cost, audience and tech stack data. Each /p/{slug} page also shows a Compare side-by-side widget with three peer apps from the same niche.
Who makes mySolarEdge?
mySolarEdge is published by SolarEdge Technologies on the Apple App Store. See the full publisher portfolio (other apps by the same developer) via the More by developer block on the product page above.
What is mySolarEdge's BU Score?
mySolarEdge has a BU Score of 72/100 (Strong). The score combines App Store rating, ratings count, monetization model and revenue signals calibrated against founder-verified MRR anchors. See the BU Score formula.