29K iOS Apps Tracked Updated 1 min ago Revenue Forecasts
Add an app Create Account Sign In
Home

MyTSA

74
Quality Score
Strong

MyTSA

High confidence
4.6 ✍️ Editor
✍️ bumetric analysis

MyTSA is an iOS app from Transportation Security Administration in the Travel category, currently rated 4.6★ across 31,698 ratings. Initial signal reads as mixed reviews: supporters praise core features while critics cite stability and value gaps.

Quality Score is 74: Strong (healthy traction). For a Travel app, that means healthy traction. The full BU Investment Matrix below scores 8 dimensions including monetisation, growth, and operational risk.

Track changes month-over-month in the Performance section below: live snapshot history and revenue forecast included.

💰 Monthly revenue · now vs forecast
● Right now
$5.0K
per month
12-mo forecast
$5.2K – $10.8K
per month
24-mo forecast
$6.4K – $19.2K
per month
MID tierFREE
💡 Grow this revenue
Free AI audit of this app’s store listing
  • Title & subtitle keyword fit
  • Description hook & conversion structure
  • Screenshots, ratings, reviews strategy
Run free AI audit →
Typical impact: +2-5× organic installs
🔔Notify me when this app's revenue changes by

📊 Performance Tracking LIVE

Loading…
idle
0%
Rating
Reviews
Forecast Revenue / mo
Snapshots tracked
0
since first record
ONE-TIME · BUILD 💰 Estimated build cost
$65K
What it cost to build · not monthly revenue
Likely range $50K – $90K
$25K · MVP floor $100K · indie scale $500K+ · studio build
📈 Pays back in ~3.6y at current MRR

Synthetic estimate. Inputs: category complexity, file size, screen count, monetization layer, platform reach, age × team-size proxy. Calibrated against 2024-2026 indie-agency rate surveys. Full math + source list on /methodology.

Where the money goes
🧱 MVP baseline (design + 1-store ship) +$28K
📱 5 unique screens × $4.5K +$22K
Travel complexity ×1.30 +$15K
Total estimate $65K
ONE-TIME · EXIT VALUE 💵 Estimated acquisition value
$25K
What it would sell for · not monthly revenue
Marketplace range $20K – $30K · 16× MRR multiple
💸 ~0.4× build cost (under-water)

Synthetic estimate. Multiple band derived from ad-supported + age, rating quality, category demand, and user-base maturity. Calibrated against 2024-2026 indie-app-marketplace closed-deal medians. Full math + comparable deal list on /methodology.

How the multiple was built
📺 Ad-supported base 15× MRR
★ rating ≥ 4.4 (solid) +8%
Final multiple 16× MRR
👥 Estimated audience size
3.5M
Lifetime downloads (US-equivalent)
Monthly active
345K
Daily active
51K

Synthetic estimate from ratings × category benchmarks. Calibrated against 2024-2026 mobile-attribution retention + DAU/MAU reports. Numbers are US-storefront-equivalent — true global audience can be 5-10× larger for international apps. Full math + source list on /methodology.

How we sized it
📲 Travel engagement ~110 installs / rating
🔁 Travel D30 retention 10%
📍 DAU / MAU stickiness 0.15
DAU / MAU 15% sticky
🔬

How we forecast this revenue

MEDIUM CONFIDENCE
Baseline
$5.0K/mo · ML-estimated from 234 triggers
Growth rate
+4.0% MoM · MID tier baseline (compound monthly)
6 months
$4.7K – $7.9K
12 months
$5.2K – $10.8K
24 months
$6.4K – $19.2K
Compound growth at +4.0% MoM (tier baseline for MID). Range widens with horizon — typical noise band ±25% at 6mo.. Ranges widen with horizon — distant futures carry more uncertainty.
📊

BU Investment Matrix

Stalled · 33/100MID TIERFREE (NO MONETIZATION)no growth momentum
GrowthFounderQualityRevenueMonetiz.MoatMarketSafety
Growth Velocity
5.0
Founder Strength
3.0
Product Quality
7.8
Revenue Strength
3.7
Monetization Maturity
0.5
Defensibility
4.5
Market Position
2.0
Operational Safety
0.0
  • 💰 Revenue: Modest — $3K - $7K/mo · MID tier · medium confidence, trajectory unclear.
  • ⭐ Quality: 4.64★ across 31,698 reviews — strong (top 10%).
  • 📍 Market: Not yet charting in any of the 9 monitored markets.
  • 📈 Growth: ⚠ last update 543d ago — possibly dormant.
  • ⚠️ Risk: High — bug mentions above category norm, rating drift -2.96 ★ (recent 50 vs lifetime), dormant (543d since update).
🎯 For competitors: Vulnerable. Quality drift + slow updates create a clear opening for a fresh competitor with active dev cadence.
💵 For acquirers: Estimated asking range 12-22× monthly = $60K-$110K. Discount applied for operational risk..
Composite of 8 dimensions computed deterministically from public signals — no LLM, every score traces back to a measurable input. Default weights shown; "compete" / "acquire" / "invest" lenses re-weight without re-fetching.
Range:

💰 Forecast Revenue / mo

MODEL
Revenue forecast computed from BU's 234 trigger model on each snapshot. Calibrated against ground-truth from 58 verified-revenue apps.
🔬Forecast Breakdown — Why This Estimate?Top 10 of 10 triggers
Our ML model uses 200+ signals from public data. These are the most influential for this app:
Mid install base (31,698 ratings)METRIC
+$5,500
Excellent rating (4.6★)METRIC
+$2,200
frequent crashesREVIEW
−$2,000
bugsREVIEW
−$1,800
excellent appREVIEW
+$1,500
Mature app (15y old)METRIC
+$1,500
highly recommendREVIEW
+$1,400
slowREVIEW
−$1,200
Ad-supported / freemiumMETRIC
+$600
Single-language (English only)METRIC
−$400
METRIC = structural app data · REVIEW = mined from user reviews · ✓ VERIFIED = Stripe-verified anchor (TrustMRR)

📈 Reviews Growth

LIVE
Cumulative review count from first BU snapshot. Each point = a tracked update.

⭐ Rating Trend

LIVE
Average rating evolution. Updates with each new review batch.

🆕 What's New · v4.5.0

Bug fixes and enhancements.

Profile & Insights

Everything we know — and don't — about this app and its company.

Identification

App name
MyTSA
Developer
Transportation Security Administration
Bundle ID
com.sapientgs.TSA
App Store URL
Open in App Store
Category
Travel
Content rating
4+
Languages
EN

Company

Website
Not found
Tagline
Not found
Description
Not found
Founded
Not found
HQ / Address
Not found
Employees
Not found
Logo
Not found

Revenue

Verified revenue / mo
Not found
AI revenue estimate / mo
Not found
AI annual estimate
Not found
ML model estimate / mo
$1.5K/mo
Top-grossing rank
Outside top 100 in US Travel
All-time revenue
Not found
Pricing
Not found

Founder

Founder data not yet collected for this app.

Funding

Funding data not yet collected for this app.

Press & Links

Press & Links data not yet collected for this app.

Contacts & Socials

Contacts & Socials data not yet collected for this app.
📈Ratings growth31,698 ratings+7055% lifetimeShow 3-year history estimate ▾
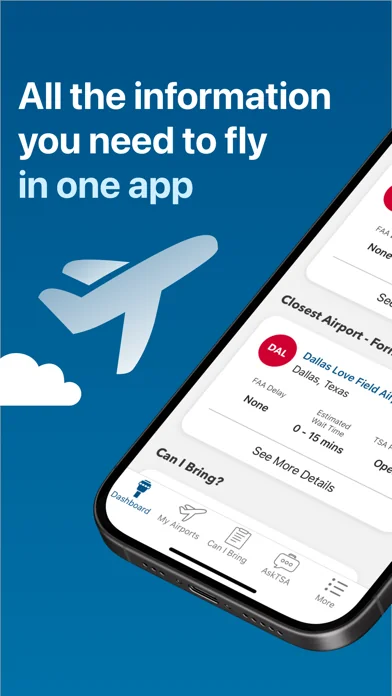
Mar 2020Jan 2024Jun 2026
Tracked (58 weeks) Pre-tracking estimate (37 weeks) · model-based, ±5% noise · anchored to release date and current value
🌍Geographic ReachNot ranked
This app is currently outside the top 100 grossing in all 9 countries we monitor (US, UK, DE, FR, JP, CA, AU, BR, IN). Niche or new apps often launch this way — popularity rankings appear once daily revenue clears the regional threshold.
Profile is built from iTunes Lookup + developer site scrape + ML revenue model. Empty fields show "Not found" — additional sources (Crunchbase, X, IndieHackers, Acquire.com) coming.

📝 About this app

Named the Best Government Mobile App from the American Council for Technology and Industry Advisory Council, and earning TSA recognition as one of the Top 15 Government IT Innovators, “MyTSA” provides 24/7 access to information that passengers frequently request from TSA.

With “MyTSA”, you can:

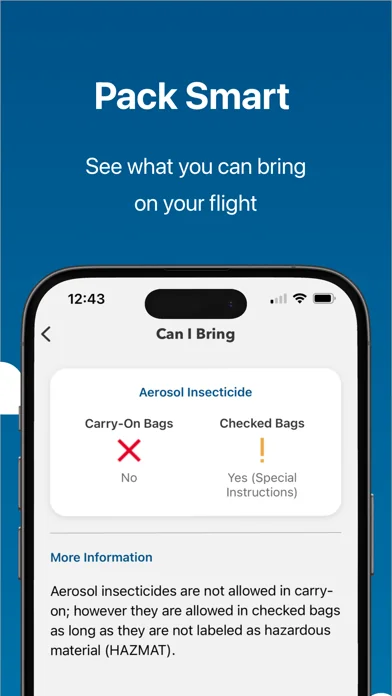
+ Quickly search which items you can bring with you through the checkpoint onto the airplane.
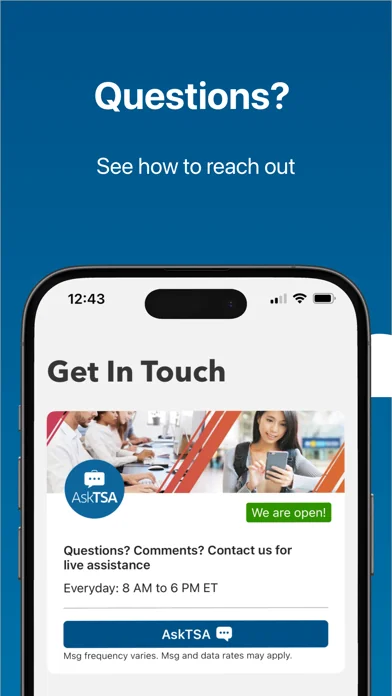
+ Request live assistance from TSA through the AskTSA social media integration.
+ Check how historically busy the airport will be on your specific day and time of travel.… View full description on the official store →
App Specs
🔐 Own this app? Claim & verify MRR →
💾 32 MB🔞 4+📱 iOS 13.0+🔖 v4.5.0🔄 updated 0d ago🌐 EN📂 Travel💰 Free
📅

What Worked™ · Development Pipeline

11 EVENTS TRACKED
Detected changes in this app over its tracked lifetime — each event links cause (what changed) to effect (what moved). Sorted newest first.See full history →Version history →
2026-05
Rating ↑ 2.41 → 4.64 (improved 2.23★)
2026-05
📈
Crossed 1,000 ratings — social-proof flywheel kicking in
2026-03
Rating ↓ 4.60 → 2.41 (dropped 2.19★)
2026-03
Rating ↑ 2.41 → 4.60 (improved 2.19★)
2026-03
📈
Crossed 500 ratings — social-proof flywheel kicking in
2012-11
📈
Crossed 100 ratings — social-proof flywheel kicking in
2011-02
📈
Crossed 50 ratings — social-proof flywheel kicking in
2010-08
📈
Crossed 10 ratings — social-proof flywheel kicking in
2010-08
Rating ↑ 1.75 → 2.40 (improved 0.65★)
2010-08
Rating ↑ 1.00 → 1.75 (improved 0.75★)
2010-07
🚀
First tracked snapshot — initial data captured
🗣

Voice of Customer

Based on 515 reviews across 5 markets
● 51% positive  ·  ● 14% neutral  ·  ● 35% negative  ·  Rating drift: -2.96★ (declining — recent 50: 1.68★ vs lifetime: 4.64★)
−10+12010-Q32011-Q32012-Q42014-Q22016-Q32018-Q12019-Q12020-Q12024-Q2
VADER compound sentiment per quarter (−1 = fully negative, +1 = fully positive). Each point ≥ 5 reviews.
Sentiment by country (−1 to +1)
🇨🇦 CA
+0.54
🇺🇸 US
+0.16
🇯🇵 JP
+0.09
🇬🇧 GB
-0.15
🇦🇺 AU
-0.40
Top praise themes
tsa pre ×5 pre check ×4 airport delays ×4 bring feature ×4 new design ×3 helpful wish ×3 works fine ×3 works now ×3
Top complaint themes
wait minutes ×15 doesn't work ×14 tsa pre ×11 tsa precheck ×9 select airport ×7 please fix ×7 keeps crashing ×7 pre check ×6
Risk signals
Bug mentions: 18%
🌍

Multi-Country Performance

Available in 9 of 9 monitored markets
MarketRatingReviewsCurrent version
🇦🇺 AU4.03125★324.03125★ this version
🇧🇷 BR4.52632★194.52632★ this version
🇨🇦 CA4.54545★1544.54545★ this version
🇩🇪 DE4.63333★304.63333★ this version
🇫🇷 FR3.90909★113.90909★ this version
🇬🇧 GB4.49057★534.49057★ this version
🇮🇳 IN4.75★124.75★ this version
🇯🇵 JP4.5★164.5★ this version
🇺🇸 US4.64161★31,6924.64161★ this version
🔔

Track this app’s revenue

FREE
Get an email when revenue moves by your threshold. No spam, unsubscribe in one click.

📝 Description

95
BU Score · Transcendent
Full revenue analysis
Read the article-style breakdown for MyTSA: category rank, percentile, growth signal, comparable apps, and how the forecast is calibrated against verified-MRR anchors in this niche.
Read deep-dive →

Similar apps in Travel

About this analysis
ZCAnalyzed by Zakhar Chumak · founder, bumetric·Full methodology·High confidence

Why high confidence: 31,698 ratings · no founder-verified revenue (model estimate only).

Frequently Asked Questions

4 answers · auto-generated from this app's public data
How much does MyTSA make per month?
Based on our ML-calibrated revenue forecast, MyTSA earns approximately $1.5K/mo. This is a US-storefront-equivalent estimate; global revenue can be several times larger for internationally-distributed apps. See the methodology page for the full formula and confidence bands.
What apps are like MyTSA?
Browse the full Travel category catalog to find similar apps with revenue, build cost, audience and tech stack data. Each /p/{slug} page also shows a Compare side-by-side widget with three peer apps from the same niche.
Who makes MyTSA?
MyTSA is published by Transportation Security Administration on the Apple App Store. See the full publisher portfolio (other apps by the same developer) via the More by developer block on the product page above.
What is MyTSA's BU Score?
MyTSA has a BU Score of 74/100 (Strong). The score combines App Store rating, ratings count, monetization model and revenue signals calibrated against founder-verified MRR anchors. See the BU Score formula.