29K iOS Apps Tracked Updated 10 min ago Revenue Forecasts
Add an app Create Account Sign In
Home

Robinhood Trading & Investing

81
Quality Score
Excellent

Robinhood Trading & Investing

High confidence
4.3 ✍️ Editor
✍️ bumetric analysis

This iOS Finance app targets a broad retail investment audience, offering commission-free trading and advanced tools for active investors. Its direct competitors include established brokerages like Fidelity and Schwab, alongside newer fintech players such as Webull and Public. With over 4.7 million ratings and a strong average score, the app demonstrates significant user traction and market penetration, indicating a mature growth stage rather than early development. The estimated monthly revenue, while modest for its user base, suggests a stable freemium model that effectively converts a segment of its large free user base into paying subscribers, likely through its premium subscription offering. In the finance category, a common monetization observation is the strong emphasis on subscription-based services that offer enhanced features or better rates, as users are often willing to pay for perceived financial advantage or convenience.

BU Score 81 · Excellent — strong product-market fit. The full Investment Matrix below scores 8 dimensions including monetisation, growth, and operational risk.

Track snapshot history and revenue forecast in the Performance section below.

💰 Monthly revenue · now vs forecast
● Right now
$2.0M
per month
12-mo forecast
$2.1M – $3.3M
per month
24-mo forecast
$2.5M – $4.7M
per month
BIG tier
💡 Grow this revenue
Free AI audit of this app’s store listing
  • Title & subtitle keyword fit
  • Description hook & conversion structure
  • Screenshots, ratings, reviews strategy
Run free AI audit →
Typical impact: +2-5× organic installs
🔔Notify me when this app's revenue changes by

📊 Performance Tracking LIVE

Loading…
idle
0%
Rating
Reviews
Forecast Revenue / mo
Snapshots tracked
0
since first record
ONE-TIME · BUILD 💰 Estimated build cost
$145K
What it cost to build · not monthly revenue
Likely range $110K – $195K
$25K · MVP floor $100K · indie scale $500K+ · studio build
📈 Slow ROI — current MRR is well below build cost

Synthetic estimate. Inputs: category complexity, file size, screen count, monetization layer, platform reach, age × team-size proxy. Calibrated against 2024-2026 indie-agency rate surveys. Full math + source list on /methodology.

Where the money goes
🧱 MVP baseline (design + 1-store ship) +$28K
📱 5 unique screens × $4.5K +$22K
📦 Asset bundle (804 MB) +$40K
Finance complexity ×1.60 +$54K
Total estimate $145K
ONE-TIME · EXIT VALUE 💵 Estimated acquisition value
$20K
What it would sell for · not monthly revenue
Marketplace range $15K – $30K · 19× MRR multiple
💸 ~0.1× build cost (under-water)

Synthetic estimate. Multiple band derived from ad-supported + age, rating quality, category demand, and user-base maturity. Calibrated against 2024-2026 indie-app-marketplace closed-deal medians. Full math + comparable deal list on /methodology.

How the multiple was built
📺 Ad-supported base 15× MRR
🏷 Finance category multiple +15%
Mature user base (1M+ ratings) +8%
Final multiple 19× MRR
👥 Estimated audience size
284.5M
Lifetime downloads (US-equivalent)
Monthly active
79.5M
Daily active
31.5M

Synthetic estimate from ratings × category benchmarks. Calibrated against 2024-2026 mobile-attribution retention + DAU/MAU reports. Numbers are US-storefront-equivalent — true global audience can be 5-10× larger for international apps. Full math + source list on /methodology.

How we sized it
📲 Finance engagement ~60 installs / rating
🔁 Finance D30 retention 28%
📍 DAU / MAU stickiness 0.40
DAU / MAU 40% sticky
🔬

How we forecast this revenue

MEDIUM CONFIDENCE
Baseline
$2.0M/mo · ML-estimated from 234 triggers
Growth rate
+2.5% MoM · BIG tier baseline (compound monthly)
6 months
$2.0M – $2.7M
12 months
$2.1M – $3.3M
24 months
$2.5M – $4.7M
Compound growth at +2.5% MoM (tier baseline for BIG). Range widens with horizon — typical noise band ±15% at 6mo.. Ranges widen with horizon — distant futures carry more uncertainty.
📊

BU Investment Matrix

Mixed signals · 55/100BIG TIERcompetitive but cautious
GrowthFounderQualityRevenueMonetiz.MoatMarketSafety
Growth Velocity
5.0
Founder Strength
6.6
Product Quality
8.6
Revenue Strength
6.3
Monetization Maturity
1.0
Defensibility
6.0
Market Position
0.6
Operational Safety
10.0
  • 💰 Revenue: Healthy — $800K - $4400K/mo · BIG tier · medium-low confidence, trajectory unclear.
  • ⭐ Quality: 4.28★ across 4,745,730 reviews — strong (top 10%).
  • 📍 Market: Not yet charting in any of the 9 monitored markets.
  • 📈 Growth: Insufficient signal to assess trajectory.
  • ⚠️ Risk: Low — no material risk signals detected.
🎯 For competitors: Mixed picture. Worth competing if you have a clear UX or pricing edge — otherwise crowded segment.
💵 For acquirers: Estimated asking range 18-32× monthly = $36.0M-$64.0M.
Composite of 8 dimensions computed deterministically from public signals — no LLM, every score traces back to a measurable input. Default weights shown; "compete" / "acquire" / "invest" lenses re-weight without re-fetching.
Range:

💰 Forecast Revenue / mo

MODEL
Revenue forecast computed from BU's 234 trigger model on each snapshot. Calibrated against ground-truth from 58 verified-revenue apps.
🔬Forecast Breakdown — Why This Estimate?Top 11 of 11 triggers
Our ML model uses 200+ signals from public data. These are the most influential for this app:
High install base (4,745,730 ratings)METRIC
+$12,000
bugsREVIEW
−$1,800
5 starREVIEW
+$1,800
cancelledREVIEW
−$1,500
excellent appREVIEW
+$1,500
Mature app (11y old)METRIC
+$1,500
slowREVIEW
−$1,200
support teamREVIEW
+$900
Good rating (4.3★)METRIC
+$800
Ad-supported / freemiumMETRIC
+$600
Single-language (English only)METRIC
−$400
METRIC = structural app data · REVIEW = mined from user reviews · ✓ VERIFIED = Stripe-verified anchor (TrustMRR)

📈 Reviews Growth

LIVE
Cumulative review count from first BU snapshot. Each point = a tracked update.

⭐ Rating Trend

LIVE
Average rating evolution. Updates with each new review batch.

🆕 What's New · v2026.20.0

Here's what's under the hood in our latest update:
- Bug fixes and improvements

Profile & Insights

Everything we know — and don't — about this app and its company.

Identification

App name
Robinhood Trading & Investing
Developer
Robinhood Markets, Inc.
Bundle ID
com.robinhood.release.Robinhood
App Store URL
Open in App Store
Category
Finance
Content rating
17+
Languages
EN

Company

Website
robinhood.com
Tagline
All Ihre Investments an einem Ort
Description
Mit Robinhood EU können Sie nicht nur Aktien-Token sondern auch Kryptowährungen kaufen, verkaufen und verwalten – alles an einem Ort. Schon ab 1 EUR Anlagesumme.
Founded
Not found
HQ / Address
Not found
Employees
Not found
Logo
Available

Revenue

Verified revenue / mo
Not found
AI revenue estimate / mo
Not found
AI annual estimate
Not found
ML model estimate / mo
$1.1K/mo
Top-grossing rank
Outside top 100 in US Finance
All-time revenue
Not found
Pricing
Not found

Founder

Name
Not found
X / Twitter
x.com/robinhoodapp_eu
LinkedIn
linkedin.com/company/robinhood
GitHub
Not found
X followers
Not found
Public statements
Not found

Funding

Funding data not yet collected for this app.

Press & Links

Press & Links data not yet collected for this app.

Contacts & Socials

Socials
facebook facebook.com/RobinhoodAppEU · instagram instagram.com/robinhoodapp_eu · linkedin linkedin.com/company/robinhood · twitter x.com/robinhoodapp_eu
Email
Not found
Phone
Not found
Contact page
robinhood.com/support
About page
robinhood.com/eu/en/about/legal
AI Revenue EstimateCONFIDENCE: LOW
Publicly available sources, including Sensor Tower and financial reports, provide comprehensive revenue figures for Robinhood Markets, Inc. as a whole, but do not offer a specific breakdown for the iOS app 'Robinhood Trading & Investing'. Robinhood Markets, Inc. reported an annual revenue of $4.473 billion in 2025 and $1.07 billion for Q1 2026. Therefore, a direct revenue estimate for the iOS app alone cannot be provided from public sources.
Sources mentioned: Sensor Tower, Statista, Adapty, Reddit, Business of Apps, Macrotrends, TIKR.com, Robinhood Investor Relations, Companies Market Cap, KuCoin
📈Ratings growth4,745,730 ratings+33% lifetimeShow 3-year history estimate ▾
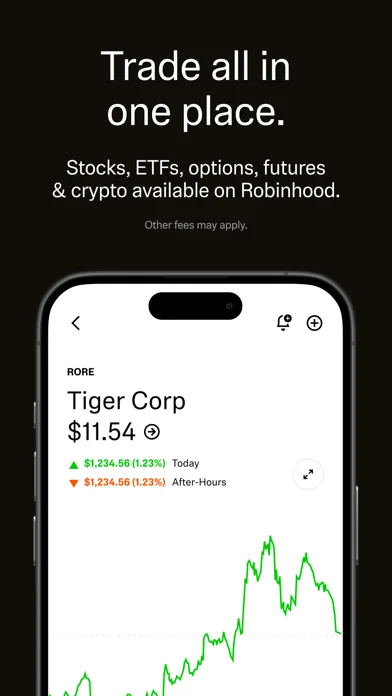
Jun 2023May 2025Jun 2026
Tracked (9 weeks) Pre-tracking estimate (37 weeks) · model-based, ±5% noise · anchored to release date and current value
🌍Geographic ReachNot ranked
This app is currently outside the top 100 grossing in all 9 countries we monitor (US, UK, DE, FR, JP, CA, AU, BR, IN). Niche or new apps often launch this way — popularity rankings appear once daily revenue clears the regional threshold.
Profile is built from iTunes Lookup + developer site scrape + ML revenue model. Empty fields show "Not found" — additional sources (Crunchbase, X, IndieHackers, Acquire.com) coming.

📝 About this app

Robinhood helps you run your money your way. Identify trends for your investing strategies with technical indicators like moving average (MA), relative strength index (RSI), and more.

TRADING
-Commission-free trading on stocks, ETFs and their options
-Invest as much or as little as you want. Other fees may apply*
-Advanced trading tools - custom price alerts, advanced chards, and more

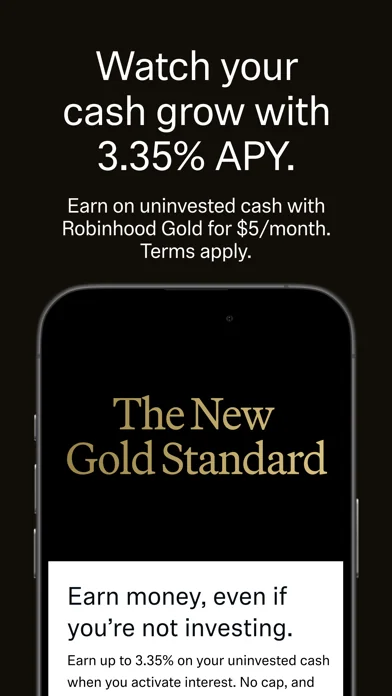
ROBINHOOD GOLD ($5/month)
-Earn 3.35% APY on uninvested cash (no cap)¹
-Get Instant Deposits up to $50,000²
-First $1K of margin investing (if eligible)³

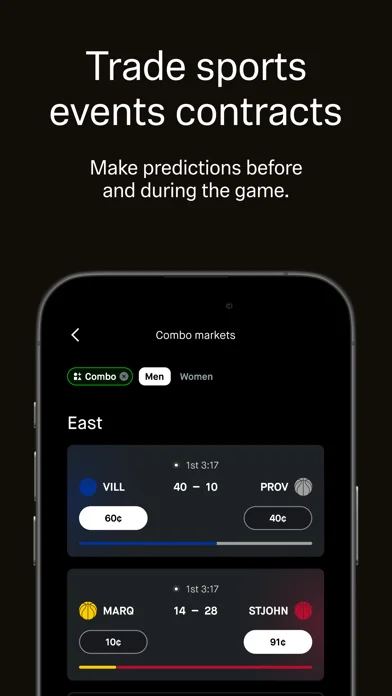
PREDICTION MARKETS… View full description on the official store →
App Specs
🔐 Own this app? Claim & verify MRR →
💾 804 MB🔞 17+📱 iOS 17.0+🔖 v2026.20.0🔄 updated 0d ago🌐 EN📂 Finance💰 Paid
📅

What Worked™ · Development Pipeline

9 EVENTS TRACKED
Detected changes in this app over its tracked lifetime — each event links cause (what changed) to effect (what moved). Sorted newest first.See full history →Version history →
2026-05
Rating ↓ 4.80 → 4.28 (dropped 0.52★)
2026-05
🔄
Monetization changed: freemium → free
2026-03
Rating ↑ 2.85 → 4.80 (improved 1.95★)
2026-03
📈
Crossed 500 ratings — social-proof flywheel kicking in
2026-02
📈
Crossed 100 ratings — social-proof flywheel kicking in
2026-02
📈
Crossed 50 ratings — social-proof flywheel kicking in
2026-01
🚀
First tracked snapshot — initial data captured
2026-01
Rating ↓ 5.00 → 3.00 (dropped 2.00★)
2026-01
📈
Crossed 10 ratings — social-proof flywheel kicking in
🔎

ASO Keyword Positions

BEST RANK #1
Ranked for 3 App Store search queryies in our last keyword sweep. Lower position = closer to the top.
investing·#1🇺🇸stocks·#2🇺🇸crypto wallet·#26🇺🇸
Last sweep: 2026-05-19 · iTunes Search API
🌍

Multi-Country Performance

Available in 2 of 9 monitored markets
MarketRatingReviewsCurrent version
🇬🇧 GB4.75452★5,0354.75452★ this version
🇺🇸 US4.28195★4,759,5814.28195★ this version
🔔

Track this app’s revenue

FREE
Get an email when revenue moves by your threshold. No spam, unsubscribe in one click.

📝 Description

95
BU Score · Transcendent
Full revenue analysis
Read the article-style breakdown for Robinhood Trading & Investing: category rank, percentile, growth signal, comparable apps, and how the forecast is calibrated against verified-MRR anchors in this niche.
Read deep-dive →

More by Robinhood Markets, Inc.

View all →
📦 Portfolio summaryINDIE studio
4apps·$81K/mocombined
Lead-app heavy — top app contributes 72%

Similar apps in Finance

About this analysis
ZCAnalyzed by Zakhar Chumak · founder, bumetric·Full methodology·High confidence

Why high confidence: 4,745,730 ratings · no founder-verified revenue (model estimate only).

Frequently Asked Questions

4 answers · auto-generated from this app's public data
How much does Robinhood Trading & Investing make per month?
Based on our ML-calibrated revenue forecast, Robinhood Trading & Investing earns approximately $1.1K/mo. This is a US-storefront-equivalent estimate; global revenue can be several times larger for internationally-distributed apps. See the methodology page for the full formula and confidence bands.
What apps are like Robinhood Trading & Investing?
Browse the full Finance category catalog to find similar apps with revenue, build cost, audience and tech stack data. Each /p/{slug} page also shows a Compare side-by-side widget with three peer apps from the same niche.
Who makes Robinhood Trading & Investing?
Robinhood Trading & Investing is published by Robinhood Markets, Inc. on the Apple App Store. See the full publisher portfolio (other apps by the same developer) via the More by developer block on the product page above.
What is Robinhood Trading & Investing's BU Score?
Robinhood Trading & Investing has a BU Score of 81/100 (Excellent). The score combines App Store rating, ratings count, monetization model and revenue signals calibrated against founder-verified MRR anchors. See the BU Score formula.