29K iOS Apps Tracked Updated 4 min ago Revenue Forecasts
Add an app Create Account Sign In
Home

Stack the Countries®

71
Quality Score
Strong

Stack the Countries®

Medium confidence
4.6 ✍️ Editor
✍️ bumetric analysis

Stack the Countries® is an iOS app from Freecloud Design, Inc. in the News category, currently rated 4.6★ across 1,004 ratings. Initial signal reads as largely positive sentiment, users highlighting consistency and feature depth.

Quality Score is 71: Strong (healthy traction). For a News app, that means healthy traction. The full BU Investment Matrix below scores 8 dimensions including monetisation, growth, and operational risk.

Track changes month-over-month in the Performance section below: live snapshot history and revenue forecast included.

💰 Monthly revenue · now vs forecast
● Right now
$700K
per month
12-mo forecast
$741K – $1141K
per month
24-mo forecast
$886K – $1645K
per month
BIG tier
💡 Grow this revenue
Free AI audit of this app’s store listing
  • Title & subtitle keyword fit
  • Description hook & conversion structure
  • Screenshots, ratings, reviews strategy
Run free AI audit →
Typical impact: +2-5× organic installs
🔔Notify me when this app's revenue changes by

📊 Performance Tracking LIVE

Loading…
idle
0%
Rating
Reviews
Forecast Revenue / mo
Snapshots tracked
0
since first record
ONE-TIME · BUILD 💰 Estimated build cost
$100K
What it cost to build · not monthly revenue
Likely range $75K – $135K
$25K · MVP floor $100K · indie scale $500K+ · studio build
📈 Pays back in ~5 months at current MRR

Synthetic estimate. Inputs: category complexity, file size, screen count, monetization layer, platform reach, age × team-size proxy. Calibrated against 2024-2026 indie-agency rate surveys. Full math + source list on /methodology.

Where the money goes
🧱 MVP baseline (design + 1-store ship) +$28K
📱 5 unique screens × $4.5K +$22K
📦 Asset bundle (132 MB) +$32K
News complexity ×1.20 +$16K
Total estimate $100K
ONE-TIME · EXIT VALUE 💵 Estimated acquisition value
$325K
What it would sell for · not monthly revenue
Marketplace range $250K – $425K · 15× MRR multiple
💸 ~3.2× return on build cost

Synthetic estimate. Multiple band derived from ad-supported + age, rating quality, category demand, and user-base maturity. Calibrated against 2024-2026 indie-app-marketplace closed-deal medians. Full math + comparable deal list on /methodology.

How the multiple was built
📺 Ad-supported base 15× MRR
★ rating ≥ 4.4 (solid) +8%
🏷 News category multiple -5%
Final multiple 15× MRR
👥 Estimated audience size
120K
Lifetime downloads (US-equivalent)
Monthly active
18K
Daily active
8.1K

Synthetic estimate from ratings × category benchmarks. Calibrated against 2024-2026 mobile-attribution retention + DAU/MAU reports. Numbers are US-storefront-equivalent — true global audience can be 5-10× larger for international apps. Full math + source list on /methodology.

How we sized it
📲 News engagement ~120 installs / rating
🔁 News D30 retention 15%
📍 DAU / MAU stickiness 0.45
DAU / MAU 45% sticky
🔬

How we forecast this revenue

MEDIUM CONFIDENCE
Baseline
$700K/mo · ML-estimated from 234 triggers
Growth rate
+2.5% MoM · BIG tier baseline (compound monthly)
6 months
$690K – $933K
12 months
$741K – $1.1M
24 months
$886K – $1.6M
Compound growth at +2.5% MoM (tier baseline for BIG). Range widens with horizon — typical noise band ±15% at 6mo.. Ranges widen with horizon — distant futures carry more uncertainty.
📊

BU Investment Matrix

Mixed signals · 58/100BIG TIERcompetitive but cautious
GrowthFounderQualityRevenueMonetiz.MoatMarketSafety
Growth Velocity
5.0
Founder Strength
7.6
Product Quality
8.2
Revenue Strength
5.8
Monetization Maturity
1.0
Defensibility
7.5
Market Position
2.0
Operational Safety
9.0
  • 💰 Revenue: Healthy — $280K - $1540K/mo · BIG tier · medium-low confidence, trajectory unclear.
  • ⭐ Quality: 4.56★ across 1,004 reviews — strong (top 10%).
  • 📍 Market: Not yet charting in any of the 9 monitored markets.
  • 📈 Growth: last update 217d ago — slow cadence.
  • ⚠️ Risk: Low — no material risk signals detected.
🎯 For competitors: Mixed picture. Worth competing if you have a clear UX or pricing edge — otherwise crowded segment.
💵 For acquirers: Estimated asking range 18-32× monthly = $12.6M-$22.4M.
Composite of 8 dimensions computed deterministically from public signals — no LLM, every score traces back to a measurable input. Default weights shown; "compete" / "acquire" / "invest" lenses re-weight without re-fetching.
Range:

💰 Forecast Revenue / mo

MODEL
Revenue forecast computed from BU's 234 trigger model on each snapshot. Calibrated against ground-truth from 58 verified-revenue apps.
🔬Forecast Breakdown — Why This Estimate?Top 9 of 9 triggers
Our ML model uses 200+ signals from public data. These are the most influential for this app:
Paid app ($0.00)METRIC
+$2,800
Excellent rating (4.6★)METRIC
+$2,200
bugsREVIEW
−$1,800
5 starREVIEW
+$1,800
excellent appREVIEW
+$1,500
Low install base (1,004 ratings)METRIC
+$1,500
Mature app (15y old)METRIC
+$1,500
highly recommendREVIEW
+$1,400
Single-language (English only)METRIC
−$400
METRIC = structural app data · REVIEW = mined from user reviews · ✓ VERIFIED = Stripe-verified anchor (TrustMRR)

📈 Reviews Growth

LIVE
Cumulative review count from first BU snapshot. Each point = a tracked update.

⭐ Rating Trend

LIVE
Average rating evolution. Updates with each new review batch.

🆕 What's New · v3.6

* Fixed Turkey not showing in correct position on Europe map
* Add Spain as a bordering country of Morocco
* Updated Botswana and Zambia as bordering countries
* Updated languages of Lesotho
* Updated languages of Zimbabwe

Profile & Insights

Everything we know — and don't — about this app and its company.

Identification

App name
Stack the Countries®
Developer
Freecloud Design, Inc.
Bundle ID
com.freecloud.StackTheCountries
App Store URL
Open in App Store
Category
News
Content rating
4+
Languages
EN

Company

Website
Not found
Tagline
Dan R-P
Description
Games, Art, Photography and more...
Founded
Not found
HQ / Address
Not found
Employees
Not found
Logo
Available

Revenue

Verified revenue / mo
Not found
AI revenue estimate / mo
Not found
AI annual estimate
Not found
ML model estimate / mo
$20.7K/mo
Top-grossing rank
Outside top 100 in US News
All-time revenue
Not found
Pricing
Not found

Founder

Founder data not yet collected for this app.

Funding

Funding data not yet collected for this app.

Press & Links

Press & Links data not yet collected for this app.

Contacts & Socials

Socials
facebook facebook.com/DanRussellPinson · instagram instagram.com/danrussellpinson · twitter twitter.com/DanRP
Email
Not found
Phone
Not found
Contact page
dan-russell-pinson.com/contact
About page
dan-russell-pinson.com/about
📈Ratings growth1,004 ratings+19% lifetimeShow 3-year history estimate ▾Jun 2023Oct 2024Jun 2026
Tracked (58 weeks) Pre-tracking estimate (36 weeks) · model-based, ±5% noise · anchored to release date and current value
🌍Geographic ReachNot ranked
This app is currently outside the top 100 grossing in all 9 countries we monitor (US, UK, DE, FR, JP, CA, AU, BR, IN). Niche or new apps often launch this way — popularity rankings appear once daily revenue clears the regional threshold.
💰Pricing History$0.00 → $2.99 (+0%)
Profile is built from iTunes Lookup + developer site scrape + ML revenue model. Empty fields show "Not found" — additional sources (Crunchbase, X, IndieHackers, Acquire.com) coming.

📝 About this app

- Featured on the TODAY show!
- Editor's Choice Award! - Children's Technology Review
- "Stack the Countries is worth every penny and this is an educational purchase that you absolutely will not regret." - The iPhone Mom

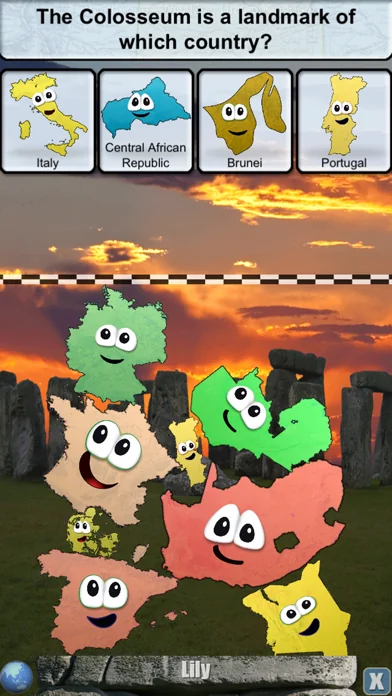
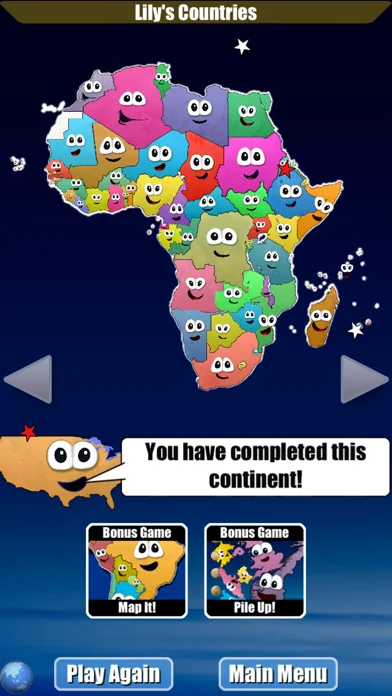
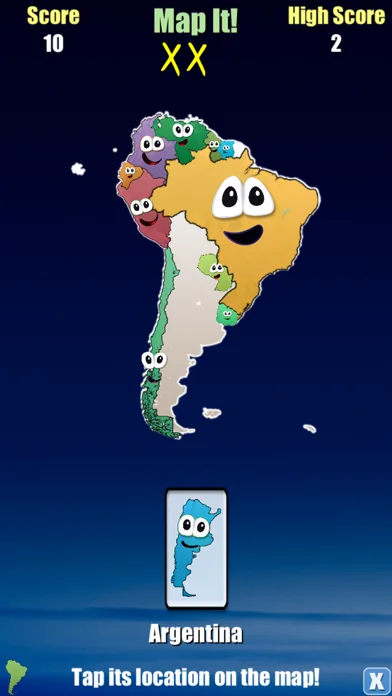
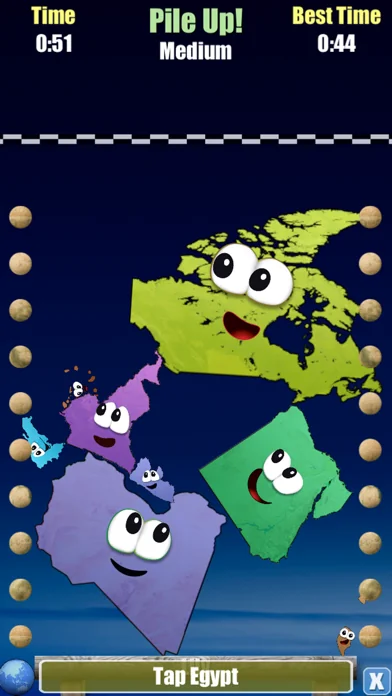
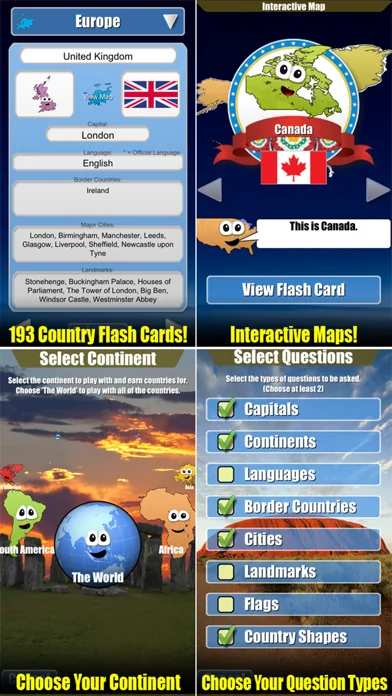
Stack the Countries® makes learning about the world fun! Watch the countries actually come to life in this colorful and dynamic game!

As you learn country capitals, landmarks, geographic locations and more, you can actually touch, move and drop the animated countries anywhere on the screen.… View full description on the official store →
App Specs
🔐 Own this app? Claim & verify MRR →
💾 132 MB🔞 4+📱 iOS 12.0+🔖 v3.6🔄 updated 0d ago🌐 EN📂 News💰 Paid
📅

What Worked™ · Development Pipeline

7 EVENTS TRACKED
Detected changes in this app over its tracked lifetime — each event links cause (what changed) to effect (what moved). Sorted newest first.See full history →Version history →
2026-05
📈
Crossed 1,000 ratings — social-proof flywheel kicking in
2026-05
💲
Went paid — introduced $2.99 price point
2026-02
📈
Crossed 500 ratings — social-proof flywheel kicking in
2013-06
📈
Crossed 100 ratings — social-proof flywheel kicking in
2013-04
📈
Crossed 50 ratings — social-proof flywheel kicking in
2013-03
📈
Crossed 10 ratings — social-proof flywheel kicking in
2013-02
🚀
First tracked snapshot — initial data captured
🌍

Multi-Country Performance

Available in 9 of 9 monitored markets
MarketRatingReviewsCurrent version
🇦🇺 AU4.78788★334.78788★ this version
🇧🇷 BR4.14286★74.14286★ this version
🇨🇦 CA4.6087★464.6087★ this version
🇩🇪 DE4.83333★64.83333★ this version
🇫🇷 FR5★25★ this version
🇬🇧 GB4.26667★604.26667★ this version
🇮🇳 IN4★74★ this version
🇯🇵 JP4.75★44.75★ this version
🇺🇸 US4.56163★1,0064.56163★ this version
🔔

Track this app’s revenue

FREE
Get an email when revenue moves by your threshold. No spam, unsubscribe in one click.

📝 Description

95
BU Score · Transcendent
Full revenue analysis
Read the article-style breakdown for Stack the Countries®: category rank, percentile, growth signal, comparable apps, and how the forecast is calibrated against verified-MRR anchors in this niche.
Read deep-dive →

More by Freecloud Design, Inc.

View all →
📦 Portfolio summaryMID studio
6apps·$117K/mocombined
✓ Diversified — top app contributes 24%; risk spread across portfolio

Similar apps in News

About this analysis
ZCAnalyzed by Zakhar Chumak · founder, bumetric·Full methodology·Medium confidence

Why medium confidence: 1,004 ratings · no founder-verified revenue (model estimate only).

Frequently Asked Questions

4 answers · auto-generated from this app's public data
How much does Stack the Countries® make per month?
Based on our ML-calibrated revenue forecast, Stack the Countries® earns approximately $20K/mo. This is a US-storefront-equivalent estimate; global revenue can be several times larger for internationally-distributed apps. See the methodology page for the full formula and confidence bands.
What apps are like Stack the Countries®?
Browse the full News category catalog to find similar apps with revenue, build cost, audience and tech stack data. Each /p/{slug} page also shows a Compare side-by-side widget with three peer apps from the same niche.
Who makes Stack the Countries®?
Stack the Countries® is published by Freecloud Design, Inc. on the Apple App Store. See the full publisher portfolio (other apps by the same developer) via the More by developer block on the product page above.
What is Stack the Countries®'s BU Score?
Stack the Countries® has a BU Score of 71/100 (Strong). The score combines App Store rating, ratings count, monetization model and revenue signals calibrated against founder-verified MRR anchors. See the BU Score formula.