1.2M Android Apps Tracked Updated just now Revenue Forecasts
Add an app Create Account Sign In
Home

DailyObjects

59
Quality Score
Solid

DailyObjects

Medium confidence
3.9 ✍️ Editor
✍️ bumetric analysis

DailyObjects is an Android app from Firki Wholesale Pvt. Ltd. in the Shopping category, currently rated 3.9★ across 9,437 ratings. Initial signal reads as largely positive sentiment, users highlighting consistency and feature depth.

Quality Score is 59: Solid (established niche player). For a Shopping app, that means established niche player. The full BU Investment Matrix below scores 8 dimensions including monetisation, growth, and operational risk.

Track changes month-over-month in the Performance section below: live snapshot history and revenue forecast included.

💰 Monthly revenue · now vs forecast
● Right now
$727
per month
12-mo forecast
$636 – $2292
per month
24-mo forecast
$589 – $5301
per month
INDIE tier
💡 Grow this revenue
Free AI audit of this app’s store listing
  • Title & subtitle keyword fit
  • Description hook & conversion structure
  • Screenshots, ratings, reviews strategy
Run free AI audit →
Typical impact: +2-5× organic installs
🔔Notify me when this app's revenue changes by

📊 Performance Tracking LIVE

Loading…
idle
0%
Rating
Reviews
Forecast Revenue / mo
Snapshots tracked
0
since first record
ONE-TIME · BUILD 💰 Estimated build cost
$100K
What it cost to build · not monthly revenue
Likely range $75K – $135K
$25K · MVP floor $100K · indie scale $500K+ · studio build
📈 Slow ROI — current MRR is well below build cost

Synthetic estimate. Inputs: category complexity, file size, screen count, monetization layer, platform reach, age × team-size proxy. Calibrated against 2024-2026 indie-agency rate surveys. Full math + source list on /methodology.

Where the money goes
🧱 MVP baseline (design + 1-store ship) +$28K
📱 5 unique screens × $4.5K +$22K
Shopping complexity ×1.30 +$15K
🌐 Cross-platform reach (iOS + Android) +$36K
Total estimate $100K
ONE-TIME · EXIT VALUE 💵 Estimated acquisition value
$10K
What it would sell for · not monthly revenue
Marketplace range $10K – $15K · 14× MRR multiple
💸 ~0.1× build cost (under-water)

Synthetic estimate. Multiple band derived from ad-supported + age, rating quality, category demand, and user-base maturity. Calibrated against 2024-2026 indie-app-marketplace closed-deal medians. Full math + comparable deal list on /methodology.

How the multiple was built
📺 Ad-supported base 15× MRR
★ rating 3.5-4.0 (mixed) -8%
🏷 Shopping category multiple +2%
Final multiple 14× MRR
👥 Estimated audience size
940K
Lifetime downloads (US-equivalent)
Monthly active
110K
Daily active
19K

Synthetic estimate from ratings × category benchmarks. Calibrated against 2024-2026 mobile-attribution retention + DAU/MAU reports. Numbers are US-storefront-equivalent — true global audience can be 5-10× larger for international apps. Full math + source list on /methodology.

How we sized it
📲 Shopping engagement ~100 installs / rating
🔁 Shopping D30 retention 12%
📍 DAU / MAU stickiness 0.18
DAU / MAU 18% sticky
🔬

How we forecast this revenue

LOW CONFIDENCE
Baseline
$727/mo · ML-estimated from 234 triggers
Growth rate
+6.0% MoM · INDIE tier baseline (compound monthly)
6 months
$619 – $1.4K
12 months
$636 – $2.3K
24 months
$589 – $5.3K
Compound growth at +6.0% MoM (tier baseline for INDIE). Range widens with horizon — typical noise band ±40% at 6mo.. Ranges widen with horizon — distant futures carry more uncertainty.
📊

BU Investment Matrix

Early-stage solo · 43/100INDIE TIERexpected for tier
GrowthFounderQualityRevenueMonetiz.MoatMarketSafety
Growth Velocity
5.0
Founder Strength
3.9
Product Quality
7.1
Revenue Strength
2.9
Monetization Maturity
1.0
Defensibility
4.4
Market Position
0.0
Operational Safety
10.0
  • 💰 Revenue: Marginal — $290 - $1818/mo · INDIE tier · medium confidence, trajectory unclear.
  • ⭐ Quality: 3.94★ across 9,437 reviews — solid.
  • 📍 Market: Not yet charting in any of the 9 monitored markets.
  • 📈 Growth: Insufficient signal to assess trajectory.
  • ⚠️ Risk: Low — no material risk signals detected.
🎯 For competitors: Mixed picture. Worth competing if you have a clear UX or pricing edge — otherwise crowded segment.
💵 For acquirers: Estimated asking range 18-32× monthly = $13K-$23K.
Composite of 8 dimensions computed deterministically from public signals — no LLM, every score traces back to a measurable input. Default weights shown; "compete" / "acquire" / "invest" lenses re-weight without re-fetching.
Range:

💰 Forecast Revenue / mo

MODEL
Revenue forecast computed from BU's 234 trigger model on each snapshot. Calibrated against ground-truth from 58 verified-revenue apps.
🔬Forecast Breakdown — Why This Estimate?Top 3 of 3 triggers
Our ML model uses 200+ signals from public data. These are the most influential for this app:
Low install base (9,437 ratings)METRIC
+$1,500
Mature app (9y old)METRIC
+$1,500
Ad-supported / freemiumMETRIC
+$600
METRIC = structural app data · REVIEW = mined from user reviews · ✓ VERIFIED = Stripe-verified anchor (TrustMRR)

📈 Reviews Growth

LIVE
Cumulative review count from first BU snapshot. Each point = a tracked update.

⭐ Rating Trend

LIVE
Average rating evolution. Updates with each new review batch.

Profile & Insights

Everything we know — and don't — about this app and its company.

Identification

App name
DailyObjects
Developer
Firki Wholesale Pvt. Ltd.
Bundle ID
com.dailyobjects
App Store URL
Open in App Store
Category
Shopping
Content rating
Not found
Languages
Not found

Company

Website
www.dailyobjects.com
Tagline
Not found
Description
Not found
Founded
Not found
HQ / Address
Not found
Employees
Not found
Logo
Not found

Revenue

Verified revenue / mo
Not found
AI revenue estimate / mo
Not found
AI annual estimate
Not found
ML model estimate / mo
$727/mo
Top-grossing rank
Not found
All-time revenue
Not found
Pricing
Not found

Founder

Founder data not yet collected for this app.

Funding

Funding data not yet collected for this app.

Press & Links

Press & Links data not yet collected for this app.

Contacts & Socials

Contacts & Socials data not yet collected for this app.
AI Revenue EstimateCONFIDENCE: LOW
Publicly available information provides the overall revenue for DailyObjects (Firki Wholesale Pvt. Ltd.), but not specifically for its Android app. The company's revenue from operations was approximately ₹110-111 crore ($13.17-$13.29 million USD) for the fiscal year ending March 31, 2025. Its current annualized revenue run rate (ARR) is reported to be around ₹300-330 crore ($35.93-$39.52 million USD). DailyObjects states that 65% of its sales come from its own website and mobile app combined, with the remaining from marketplaces. Without a breakdown between website and mobile app sales, and further, between iOS and Android app sales, a specific revenue estimate for the Android app cannot be determined from public sources.
Sources mentioned: Entrackr, Tracxn, The Economic Times, The Hindu, Medial App, ETRetail, FIRKI WHOLESALE PRIVATE LIMITED - 2026 Company Profile, Fina
📈Ratings growth9,437 ratings+14% lifetimeShow 3-year history estimate ▾Jun 2023Jan 2025Jun 2026
Tracked (1 weeks) Pre-tracking estimate (37 weeks) · model-based, ±5% noise · anchored to release date and current value
Profile is built from iTunes Lookup + developer site scrape + ML revenue model. Empty fields show "Not found" — additional sources (Crunchbase, X, IndieHackers, Acquire.com) coming.

📝 About this app

Elevate your everyday with DailyObjects, India’s go-to brand for designer phone cases, laptop sleeves, watch bands, wallets, backpacks, chargers, and more.

Why download the app?
• Shop top-tier tech, mobile covers, designer goods, and personal accessories.
• Shop designer collaborations and standout pieces, crafted by artists.
• Early access to new launches and exclusive drops.
• Enjoy a personalised in-app experience every time you log in.
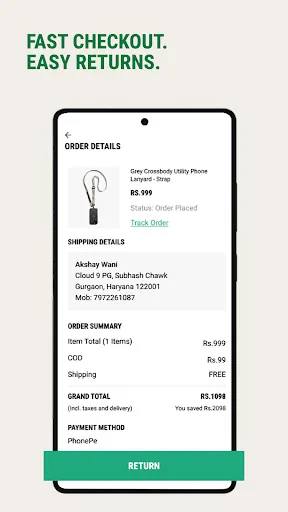
• Get smooth, fast checkout & easy returns.

Featured Categories
Phone cases & covers. Custom phone cases.… View full description on the official store →
App Specs
🔐 Own this app? Claim & verify MRR →
🔖 v2026.5.9🔄 updated 0d ago📂 Shopping💰 Free
🧪

Tech & Domain Intel — dailyobjects.com

Mail provider
Google Workspace
Tech stack
Atlassian (Jira/Confluence) · Meta (Facebook) Ads · Google Workspace
Derived from public RDAP + DNS TXT records (no scraping, no login).
🔔

Track this app’s revenue

FREE
Get an email when revenue moves by your threshold. No spam, unsubscribe in one click.

📝 Description

95
BU Score · Transcendent
Full revenue analysis
Read the article-style breakdown for DailyObjects: category rank, percentile, growth signal, comparable apps, and how the forecast is calibrated against verified-MRR anchors in this niche.
Read deep-dive →

Similar apps in Shopping

About this analysis
ZCAnalyzed by Zakhar Chumak · founder, bumetric·Full methodology·Medium confidence

Why medium confidence: 9,437 ratings · no founder-verified revenue (model estimate only).

Frequently Asked Questions

4 answers · auto-generated from this app's public data
How much does DailyObjects make per month?
Based on our ML-calibrated revenue forecast, DailyObjects earns approximately $727/mo. This is a US-storefront-equivalent estimate; global revenue can be several times larger for internationally-distributed apps. See the methodology page for the full formula and confidence bands.
What apps are like DailyObjects?
Browse the full Shopping category catalog to find similar apps with revenue, build cost, audience and tech stack data. Each /p/{slug} page also shows a Compare side-by-side widget with three peer apps from the same niche.
Who makes DailyObjects?
DailyObjects is published by Firki Wholesale Pvt. Ltd. on the Google Play Store. See the full publisher portfolio (other apps by the same developer) via the More by developer block on the product page above.
What is DailyObjects's BU Score?
DailyObjects has a BU Score of 59/100 (Solid). The score combines App Store rating, ratings count, monetization model and revenue signals calibrated against founder-verified MRR anchors. See the BU Score formula.