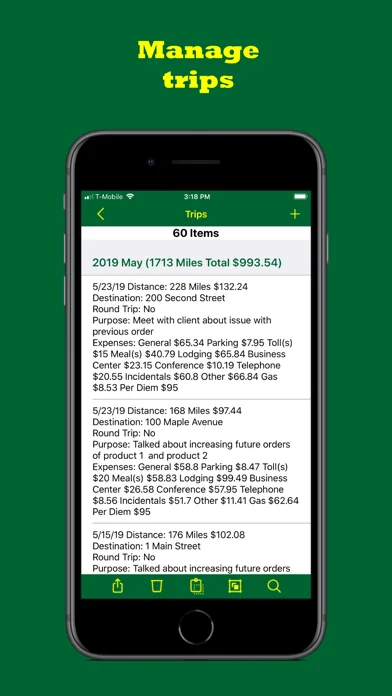
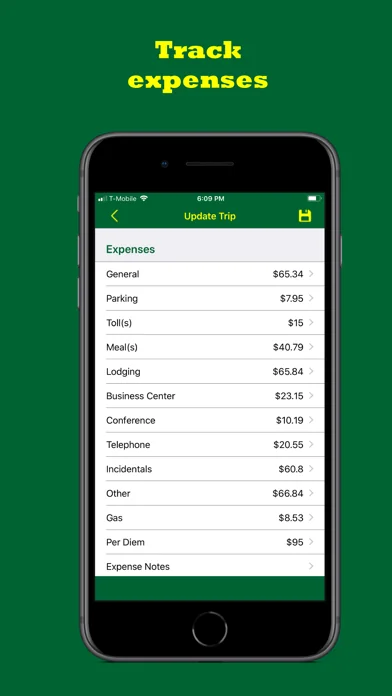
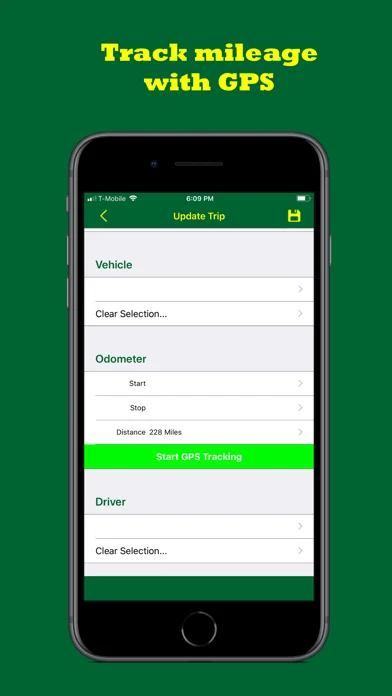
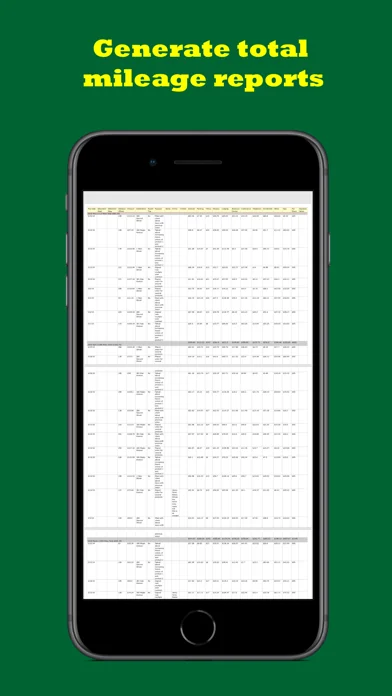
Track My Mileage And Expenses
 51
51


Track My Mileage And Expenses is an iOS app from APG Solutions, LLC in the Business category, currently rated 4.8★ across 5 ratings. Initial signal reads as mixed reviews: supporters praise core features while critics cite stability and value gaps.
Quality Score is 51: Solid (established niche player). For a Business app, that means established niche player. The full BU Investment Matrix below scores 8 dimensions including monetisation, growth, and operational risk.
Track changes month-over-month in the Performance section below: live snapshot history and revenue forecast included.
- Title & subtitle keyword fit
- Description hook & conversion structure
- Screenshots, ratings, reviews strategy
📊 Performance Tracking LIVE

Synthetic estimate. Inputs: category complexity, file size, screen count, monetization layer, platform reach, age × team-size proxy. Calibrated against 2024-2026 indie-agency rate surveys. Full math + source list on /methodology.
| 🧱 MVP baseline (design + 1-store ship) | +$28K |
| 📱 5 unique screens × $4.5K | +$22K |
| 📦 Asset bundle (69 MB) | +$7K |
| ⚙ Business complexity ×1.50 | +$28K |
How we forecast this revenue
MEDIUM CONFIDENCEBU Investment Matrix
Below median · 48/100MID TIERunderperforming peers- 💰 Revenue: Modest — $3K - $7K/mo · MID tier · medium confidence, trajectory unclear.
- ⭐ Quality: 4.8★ across 5 reviews — weak — significant quality concerns.
- 📍 Market: Not yet charting in any of the 9 monitored markets.
- 📈 Growth: last update 186d ago — slow cadence.
- ⚠️ Risk: Low — no material risk signals detected.
💰 Forecast Revenue / mo
MODEL| Paid app ($0.00)METRIC | +$2,800 | |
| Excellent rating (4.8★)METRIC | +$2,200 | |
| Mature app (12y old)METRIC | +$1,500 | |
| Multilingual (22 languages)METRIC | +$1,500 | |
| Pre-traction phase (5 ratings)METRIC | −$300 |
📈 Reviews Growth
LIVE⭐ Rating Trend
LIVE🆕 What's New · v12.5
Update cost per mile cost to 2026 rate of 0.725 per mile (only new installs of the app will see the change). To update manually, go to Settings >> Calculate Cost Per Mile >> Cost
Fixed bug in pdf generation
Profile & Insights
Identification
- App name
- Track My Mileage And Expenses
- Developer
- APG Solutions, LLC
- Bundle ID
- com.apgsolutionsllc.APGSOLUTIONSLLC0001BundleExpenses
- App Store URL
- Open in App Store
- Category
- Business
- Content rating
- 4+
- Languages
- AF, DA, NL, EN, FI, FR, DE, EL, ID, JA, KO, MS, PT, RU, ZH, ES, SV, TH, ZH, TR, VI, CY
Company
- Website
- Not found
- Tagline
- Today
- Description
- Find apps and games for iPhone, iPad, Mac, and more on the App Store.
- Founded
- Not found
- HQ / Address
- Not found
- Employees
- Not found
- Logo
- Available
Revenue
- Verified revenue / mo
- Not found
- AI revenue estimate / mo
- Not found
- AI annual estimate
- Not found
- ML model estimate / mo
- $86/mo
- Top-grossing rank
- Outside top 100 in US Business
- All-time revenue
- Not found
- Pricing
- Not found
Founder
Funding
Press & Links
Contacts & Socials
📈Ratings growth5 ratings+400% lifetimeShow 3-year history estimate ▾
📝 About this app
What Worked™ · Development Pipeline
5 EVENTS TRACKEDTech & Domain Intel — trackmymileage.net
- Tech stack
- Stripe · Google Workspace
Multi-Country Performance
Available in 9 of 9 monitored markets| Market | Rating | Reviews | Current version |
|---|---|---|---|
| 🇺🇸 US | 4.8★ | 5 | 4.8★ this version |
| 🇬🇧 GB | 2★ | 1 | 2★ this version |
| 🇩🇪 DE | 0★ | 0 | — |
| 🇫🇷 FR | 0★ | 0 | — |
| 🇯🇵 JP | 0★ | 0 | — |
| 🇨🇦 CA | 2.5★ | 2 | 2.5★ this version |
| 🇦🇺 AU | 1★ | 1 | 1★ this version |
| 🇧🇷 BR | 0★ | 0 | — |
| 🇮🇳 IN | 0★ | 0 | — |
Track this app’s revenue
FREE📝 Description
95
More by APG Solutions, LLC
View all →


Why low confidence: only 5 ratings · no founder-verified revenue (model estimate only) · revenue figure is directional only.
Track My Mileage And Expenses is a early-stage iOS app in the business space with weak public traction — only 5 ratings, no founder-verified MRR, and not ranked in any monitored grossing chart. The app appears to be monetised, but public signals are too sparse for a precise revenue estimate.
Bottom line: treat all revenue, audience and acquisition-value numbers on this page as directional only — not founder-verified facts.