1.2M Android Apps Tracked Updated 7 min ago Revenue Forecasts
Add an app Create Account Sign In
Home

ANT+ Demo

44
Quality Score
Emerging

ANT+ Demo

Medium confidence
2.9 ✍️ Editor
✍️ bumetric analysis

ANT+ Demo is an Android app from ANT+ in the Health & Fitness category, currently rated 2.9★ across 693 ratings. Initial signal reads as mostly critical sentiment so far: users flag rough edges and unmet expectations.

Quality Score is 44: Emerging (early traction worth watching). For a Health & Fitness app, that means early traction worth watching. The full BU Investment Matrix below scores 8 dimensions including monetisation, growth, and operational risk.

Track changes month-over-month in the Performance section below: live snapshot history and revenue forecast included.

💰 Monthly revenue · now vs forecast
● Right now
$5.0K
per month
12-mo forecast
$5.2K – $10.8K
per month
24-mo forecast
$6.4K – $19.2K
per month
MID tier
💡 Grow this revenue
Free AI audit of this app’s store listing
  • Title & subtitle keyword fit
  • Description hook & conversion structure
  • Screenshots, ratings, reviews strategy
Run free AI audit →
Typical impact: +2-5× organic installs
🔔Notify me when this app's revenue changes by

📊 Performance Tracking LIVE

Loading…
idle
0%
Rating
Reviews
Forecast Revenue / mo
Snapshots tracked
0
since first record
ONE-TIME · BUILD 💰 Estimated build cost
$110K
What it cost to build · not monthly revenue
Likely range $80K – $150K
$25K · MVP floor $100K · indie scale $500K+ · studio build
📈 Slow ROI — current MRR is well below build cost

Synthetic estimate. Inputs: category complexity, file size, screen count, monetization layer, platform reach, age × team-size proxy. Calibrated against 2024-2026 indie-agency rate surveys. Full math + source list on /methodology.

Where the money goes
🧱 MVP baseline (design + 1-store ship) +$28K
📱 5 unique screens × $4.5K +$22K
Health & Fitness complexity ×1.40 +$20K
🌐 Cross-platform reach (iOS + Android) +$38K
Total estimate $110K
👥 Estimated audience size
48K
Lifetime downloads (US-equivalent)
Monthly active
10K
Daily active
3.6K

Synthetic estimate from ratings × category benchmarks. Calibrated against 2024-2026 mobile-attribution retention + DAU/MAU reports. Numbers are US-storefront-equivalent — true global audience can be 5-10× larger for international apps. Full math + source list on /methodology.

How we sized it
📲 Health & Fitness engagement ~70 installs / rating
🔁 Health & Fitness D30 retention 22%
📍 DAU / MAU stickiness 0.35
DAU / MAU 34% sticky
🔬

How we forecast this revenue

MEDIUM CONFIDENCE
Baseline
$5.0K/mo · ML-estimated from 234 triggers
Growth rate
+4.0% MoM · MID tier baseline (compound monthly)
6 months
$4.7K – $7.9K
12 months
$5.2K – $10.8K
24 months
$6.4K – $19.2K
Compound growth at +4.0% MoM (tier baseline for MID). Range widens with horizon — typical noise band ±25% at 6mo.. Ranges widen with horizon — distant futures carry more uncertainty.
📊

BU Investment Matrix

Below median · 41/100MID TIERunderperforming peers
GrowthFounderQualityRevenueMonetiz.MoatMarketSafety
Growth Velocity
5.0
Founder Strength
6.5
Product Quality
4.1
Revenue Strength
3.7
Monetization Maturity
1.0
Defensibility
7.5
Market Position
0.0
Operational Safety
5.0
  • 💰 Revenue: Modest — $3K - $7K/mo · MID tier · medium confidence, trajectory unclear.
  • ⭐ Quality: 2.94★ across 693 reviews — weak — significant quality concerns.
  • 📍 Market: Not yet charting in any of the 9 monitored markets.
  • 📈 Growth: ⚠ last update 1046d ago — possibly dormant.
  • ⚠️ Risk: Elevated — dormant (1046d since update).
🎯 For competitors: Vulnerable. Quality drift + slow updates create a clear opening for a fresh competitor with active dev cadence.
💵 For acquirers: Estimated asking range 18-32× monthly = $90K-$160K. Portfolio play ($9K/mo combined) commands premium.
Composite of 8 dimensions computed deterministically from public signals — no LLM, every score traces back to a measurable input. Default weights shown; "compete" / "acquire" / "invest" lenses re-weight without re-fetching.
Range:

💰 Forecast Revenue / mo

MODEL
Revenue forecast computed from BU's 234 trigger model on each snapshot. Calibrated against ground-truth from 58 verified-revenue apps.
🔬Forecast Breakdown — Why This Estimate?Top 4 of 4 triggers
Our ML model uses 200+ signals from public data. These are the most influential for this app:
Below-average rating (2.9★)METRIC
−$1,500
Mature app (15y old)METRIC
+$1,500
Ad-supported / freemiumMETRIC
+$600
Early-stage install base (693 ratings)METRIC
+$400
METRIC = structural app data · REVIEW = mined from user reviews · ✓ VERIFIED = Stripe-verified anchor (TrustMRR)

📈 Reviews Growth

LIVE
Cumulative review count from first BU snapshot. Each point = a tracked update.

⭐ Rating Trend

LIVE
Average rating evolution. Updates with each new review batch.

Profile & Insights

Everything we know — and don't — about this app and its company.

Identification

App name
ANT+ Demo
Developer
ANT+
Bundle ID
com.dsi.ant.antplusdemo
App Store URL
Open in App Store
Category
Health & Fitness
Content rating
Not found
Languages
Not found

Company

Website
thisisant.com
Tagline
Not found
Description
Not found
Founded
Not found
HQ / Address
Not found
Employees
Not found
Logo
Not found

Revenue

Verified revenue / mo
Not found
AI revenue estimate / mo
Not found
AI annual estimate
Not found
ML model estimate / mo
$365/mo
Top-grossing rank
Not found
All-time revenue
Not found
Pricing
Not found

Founder

Founder data not yet collected for this app.

Funding

Funding data not yet collected for this app.

Press & Links

Press & Links data not yet collected for this app.

Contacts & Socials

Contacts & Socials data not yet collected for this app.
📈Ratings growth693 ratings+11% lifetimeShow 3-year history estimate ▾
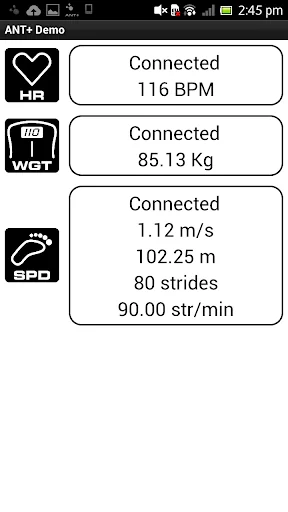
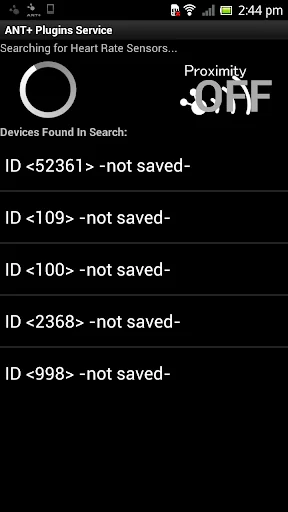
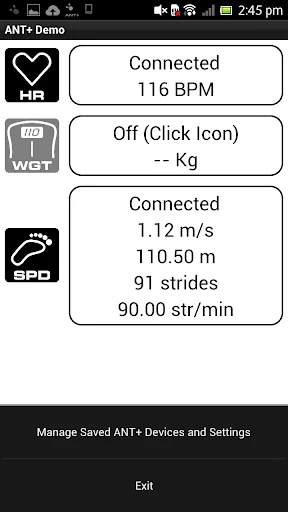
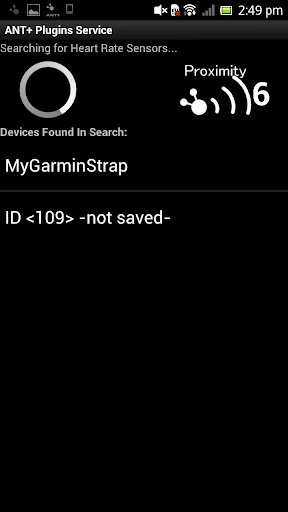
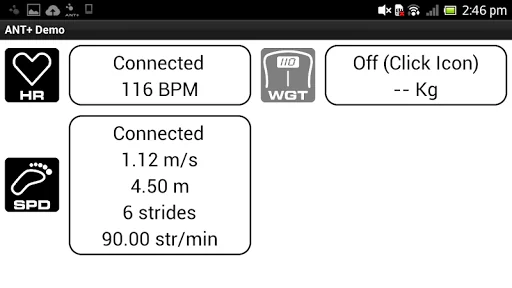
Jul 2023Feb 2025Jul 2026
Tracked (1 weeks) Pre-tracking estimate (37 weeks) · model-based, ±5% noise · anchored to release date and current value
Profile is built from iTunes Lookup + developer site scrape + ML revenue model. Empty fields show "Not found" — additional sources (Crunchbase, X, IndieHackers, Acquire.com) coming.

📝 About this app

The ANT+ Demo is a sample application for displaying your heart rate, running speed, and weight from ANT+ enabled Heart Rate Monitors, Weight Scales, and Foot Pods (Speed/Distance Monitor).

This is not intended to be a fully featured application; instead use it to verify the ANT+ connectivity in your phone or through an ANT USB stick. For a similar app which allows connection to a more complete list of device types, try out the ANT+ Plugin Sampler (https://play.google.com/store/apps/details?id=com.dsi.ant.antplus.pluginsampler)

Requires:
-ANT+ Plugins (https://play.google.… View full description on the official store →
App Specs
🔐 Own this app? Claim & verify MRR →
🔖 v3.4.0🔄 updated 0d ago📂 Health & Fitness💰 Free
🧪

Tech & Domain Intel — thisisant.com

Tech stack
Atlassian (Jira/Confluence)
Derived from public RDAP + DNS TXT records (no scraping, no login).
🔔

Track this app’s revenue

FREE
Get an email when revenue moves by your threshold. No spam, unsubscribe in one click.

📝 Description

95
BU Score · Transcendent
Full revenue analysis
Read the article-style breakdown for ANT+ Demo: category rank, percentile, growth signal, comparable apps, and how the forecast is calibrated against verified-MRR anchors in this niche.
Read deep-dive →

More by ANT+

View all →
📦 Portfolio summaryINDIE studio
8apps·$9K/mocombined
✓ Diversified — top app contributes 35%; risk spread across portfolio

Similar apps in Health & Fitness

About this analysis
ZCAnalyzed by Zakhar Chumak · founder, bumetric·Full methodology·Medium confidence

Why medium confidence: 693 ratings · no founder-verified revenue (model estimate only).

Frequently Asked Questions

4 answers · auto-generated from this app's public data
How much does ANT+ Demo make per month?
Based on our ML-calibrated revenue forecast, ANT+ Demo earns approximately $365/mo. This is a US-storefront-equivalent estimate; global revenue can be several times larger for internationally-distributed apps. See the methodology page for the full formula and confidence bands.
What apps are like ANT+ Demo?
Browse the full Health & Fitness category catalog to find similar apps with revenue, build cost, audience and tech stack data. Each /p/{slug} page also shows a Compare side-by-side widget with three peer apps from the same niche.
Who makes ANT+ Demo?
ANT+ Demo is published by ANT+ on the Google Play Store. See the full publisher portfolio (other apps by the same developer) via the More by developer block on the product page above.
What is ANT+ Demo's BU Score?
ANT+ Demo has a BU Score of 44/100 (Emerging). The score combines App Store rating, ratings count, monetization model and revenue signals calibrated against founder-verified MRR anchors. See the BU Score formula.