1.2M Android Apps Tracked Updated 2 min ago Revenue Forecasts
Add an app Create Account Sign In
Home

MyFitnessPal: Calorie Counter

81
Quality Score
Excellent

MyFitnessPal: Calorie Counter

High confidence
4.4 ✍️ Editor
✍️ bumetric analysis

MyFitnessPal targets the broad health and fitness tracking market, directly competing with apps like Lose It! and Cronometer, all focused on calorie and macro tracking for weight management. The robust user rating, supported by millions of reviews, indicates significant, sustained user traction and a mature product with a strong, established user base. This isn't an early-stage app; it’s a dominant player. Given its free monetization model, the primary revenue driver in this category is typically a premium subscription offering advanced features like ad removal, deeper analytics, or specialized meal plans. Founders in this space should consider a tiered subscription model, with a clear value proposition for each upgrade, rather than relying on one-off IAPs, as user retention is key to recurring revenue from health-focused subscriptions.

BU Score 81 · Excellent — strong product-market fit. The full Investment Matrix below scores 8 dimensions including monetisation, growth, and operational risk.

Track snapshot history and revenue forecast in the Performance section below.

💰 Monthly revenue · now vs forecast
● Right now
$1.2M
per month
12-mo forecast
$1.3M – $2.0M
per month
24-mo forecast
$1.5M – $2.8M
per month
BIG tier
💡 Grow this revenue
Free AI audit of this app’s store listing
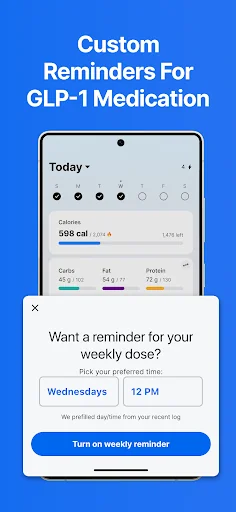
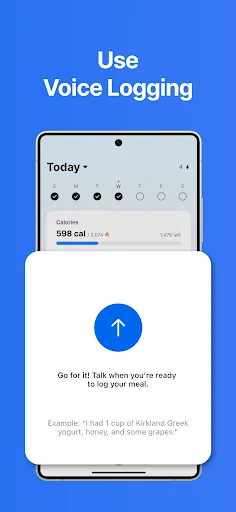
  • Title & subtitle keyword fit
  • Description hook & conversion structure
  • Screenshots, ratings, reviews strategy
Run free AI audit →
Typical impact: +2-5× organic installs
🔔Notify me when this app's revenue changes by

📊 Performance Tracking LIVE

Loading…
idle
0%
Rating
Reviews
Forecast Revenue / mo
Snapshots tracked
0
since first record
ONE-TIME · BUILD 💰 Estimated build cost
$130K
What it cost to build · not monthly revenue
Likely range $100K – $175K
$25K · MVP floor $100K · indie scale $500K+ · studio build
📈 Pays back in ~1.9y at current MRR

Synthetic estimate. Inputs: category complexity, file size, screen count, monetization layer, platform reach, age × team-size proxy. Calibrated against 2024-2026 indie-agency rate surveys. Full math + source list on /methodology.

Where the money goes
🧱 MVP baseline (design + 1-store ship) +$28K
📱 5 unique screens × $4.5K +$22K
💎 In-app purchase plumbing +$9K
Health & Fitness complexity ×1.40 +$23K
🌐 Cross-platform reach (iOS + Android) +$45K
Total estimate $130K
ONE-TIME · EXIT VALUE 💵 Estimated acquisition value
$200K
What it would sell for · not monthly revenue
Marketplace range $150K – $250K · 33× MRR multiple
💸 ~1.5× build cost (break-even+)

Synthetic estimate. Multiple band derived from iap / freemium model + age, rating quality, category demand, and user-base maturity. Calibrated against 2024-2026 indie-app-marketplace closed-deal medians. Full math + comparable deal list on /methodology.

How the multiple was built
💎 IAP / freemium model base 28× MRR
🏷 Health & Fitness category multiple +10%
Mature user base (1M+ ratings) +8%
Final multiple 33× MRR
👥 Estimated audience size
202.5M
Lifetime downloads (US-equivalent)
Monthly active
44.5M
Daily active
15.5M

Synthetic estimate from ratings × category benchmarks. Calibrated against 2024-2026 mobile-attribution retention + DAU/MAU reports. Numbers are US-storefront-equivalent — true global audience can be 5-10× larger for international apps. Full math + source list on /methodology.

How we sized it
📲 Health & Fitness engagement ~70 installs / rating
🔁 Health & Fitness D30 retention 22%
📍 DAU / MAU stickiness 0.35
DAU / MAU 35% sticky
🔬

How we forecast this revenue

MEDIUM CONFIDENCE
Baseline
$1.2M/mo · ML-estimated from 234 triggers
Growth rate
+2.5% MoM · BIG tier baseline (compound monthly)
6 months
$1.2M – $1.6M
12 months
$1.3M – $2.0M
24 months
$1.5M – $2.8M
Compound growth at +2.5% MoM (tier baseline for BIG). Range widens with horizon — typical noise band ±15% at 6mo.. Ranges widen with horizon — distant futures carry more uncertainty.
📊

BU Investment Matrix

Mixed signals · 61/100BIG TIERcompetitive but cautious
RevenueQualityMarketGrowthMoatSafetyFounderMonetiz.
Revenue Strength
6.1
Product Quality
8.8
Market Position
0.0
Growth Velocity
5.0
Defensibility
8.5
Operational Safety
10.0
Founder Strength
5.6
Monetization Maturity
5.0
  • 💰 Revenue: Healthy — $480K - $2640K/mo · BIG tier · medium-low confidence, trajectory unclear.
  • ⭐ Quality: 4.39★ across 2,899,263 reviews — strong (top 10%).
  • 📍 Market: Not yet charting in any of the 9 monitored markets.
  • 📈 Growth: Insufficient signal to assess trajectory.
  • ⚠️ Risk: Low — no material risk signals detected.
🎯 For competitors: Strong subscription moat. Hard to outcompete on retention. Better angle: free alternative with one-time purchase, or feature parity for an underserved sub-niche.
💵 For acquirers: Estimated asking range 18-32× monthly = $21.6M-$38.4M.
Composite of 8 dimensions computed deterministically from public signals — no LLM, every score traces back to a measurable input. Default weights shown; "compete" / "acquire" / "invest" lenses re-weight without re-fetching.
Range:

💰 Forecast Revenue / mo

MODEL
Revenue forecast computed from BU's 234 trigger model on each snapshot. Calibrated against ground-truth from 58 verified-revenue apps.
🔬Forecast Breakdown — Why This Estimate?Top 4 of 4 triggers
Our ML model uses 200+ signals from public data. These are the most influential for this app:
High install base (2,899,263 ratings)METRIC
+$12,000
Mature app (16y old)METRIC
+$1,500
Good rating (4.4★)METRIC
+$800
Ad-supported / freemiumMETRIC
+$600
METRIC = structural app data · REVIEW = mined from user reviews · ✓ VERIFIED = Stripe-verified anchor (TrustMRR)

📈 Reviews Growth

LIVE
Cumulative review count from first BU snapshot. Each point = a tracked update.

⭐ Rating Trend

LIVE
Average rating evolution. Updates with each new review batch.

Profile & Insights

Everything we know — and don't — about this app and its company.

Identification

App name
MyFitnessPal: Calorie Counter
Developer
MyFitnessPal, Inc.
Bundle ID
com.myfitnesspal.android
App Store URL
Open in App Store
Category
Health & Fitness
Content rating
Not found
Languages
Not found

Company

Website
www.myfitnesspal.com
Tagline
Not found
Description
Not found
Founded
Not found
HQ / Address
Not found
Employees
Not found
Logo
Not found

Revenue

Verified revenue / mo
Not found
AI revenue estimate / mo
Not found
AI annual estimate
Not found
ML model estimate / mo
$5.7K/mo
Top-grossing rank
Not found
All-time revenue
Not found
Pricing
$0.99 - $99.99 per item

Founder

Founder data not yet collected for this app.

Funding

Funding data not yet collected for this app.

Press & Links

Press & Links data not yet collected for this app.

Contacts & Socials

Contacts & Socials data not yet collected for this app.
📈Ratings growth2,899,263 ratings+21% lifetimeShow 3-year history estimate ▾Jul 2023Jan 2025Jun 2026
Tracked (1 weeks) Pre-tracking estimate (36 weeks) · model-based, ±5% noise · anchored to release date and current value
Profile is built from iTunes Lookup + developer site scrape + ML revenue model. Empty fields show "Not found" — additional sources (Crunchbase, X, IndieHackers, Acquire.com) coming.

📝 About this app

Achieve your nutrition, calorie, macro & fitness goals with MyFitnessPal – the AI-powered food & fitness tracker with everything you need. Calories, macros, food, workouts – track it all in one place with one of the most comprehensive health, nutrition & fitness tracking apps available. Now with GLP-1 journey support - log doses and set reminders in the app.

Create personalized fitness & nutrition goals, build better habits around food, nutrition & calorie tracking and monitor your water intake. Download the app & start your free Premium trial today.… View full description on the official store →
App Specs
🔐 Own this app? Claim & verify MRR →
🔖 vVaries with device🔄 updated 0d ago📂 Health & Fitness💰 Free📺 Ad-supported💎 IAP $0.99 - $99.99 per item
🔔

Track this app’s revenue

FREE
Get an email when revenue moves by your threshold. No spam, unsubscribe in one click.

📝 Description

95
BU Score · Transcendent
Full revenue analysis
Read the article-style breakdown for MyFitnessPal: Calorie Counter: category rank, percentile, growth signal, comparable apps, and how the forecast is calibrated against verified-MRR anchors in this niche.
Read deep-dive →

More by MyFitnessPal, Inc.

View all →
📦 Portfolio summaryINDIE studio
2apps·$41K/mocombined
⚠ Concentrated — top app contributes 86% of combined revenue (single-app dependency)

Similar apps in Health & Fitness

About this analysis
ZCAnalyzed by Zakhar Chumak · founder, bumetric·Full methodology·High confidence

Why high confidence: 2,899,263 ratings · no founder-verified revenue (model estimate only).

Frequently Asked Questions

4 answers · auto-generated from this app's public data
How much does MyFitnessPal make per month?
Based on our ML-calibrated revenue forecast, MyFitnessPal earns approximately $5.7K/mo. This is a US-storefront-equivalent estimate; global revenue can be several times larger for internationally-distributed apps. See the methodology page for the full formula and confidence bands.
What apps are like MyFitnessPal?
Browse the full Health & Fitness category catalog to find similar apps with revenue, build cost, audience and tech stack data. Each /p/{slug} page also shows a Compare side-by-side widget with three peer apps from the same niche.
Who makes MyFitnessPal?
MyFitnessPal is published by MyFitnessPal, Inc. on the Google Play Store. See the full publisher portfolio (other apps by the same developer) via the More by developer block on the product page above.
What is MyFitnessPal's BU Score?
MyFitnessPal has a BU Score of 81/100 (Excellent). The score combines App Store rating, ratings count, monetization model and revenue signals calibrated against founder-verified MRR anchors. See the BU Score formula.