29K iOS Apps Tracked Updated 1 min ago Revenue Forecasts
Add an app Create Account Sign In
Home

Google

85
Quality Score
Excellent

Google

High confidence
4.7 ✍️ Editor
✍️ bumetric analysis

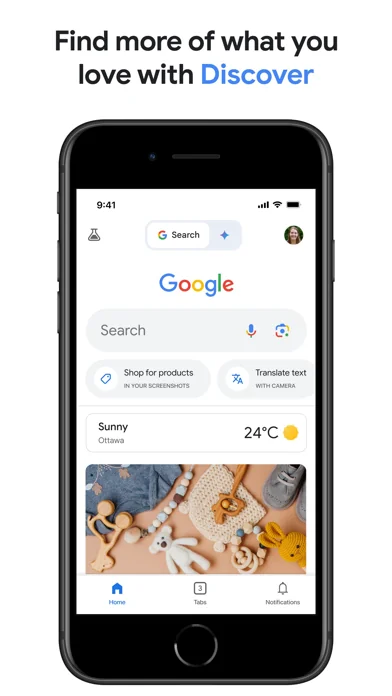
This iOS utility app, from a major developer, serves as a comprehensive information hub, directly competing with other general search engines and specialized discovery platforms. Its robust user rating and substantial volume of feedback indicate strong, sustained user adoption, signaling a mature product with established market penetration rather than early-stage growth. The app’s minimal estimated revenue, despite its massive user base, is typical for a free utility in this category. Monetization in the utility space often relies on indirect strategies: data monetization, driving traffic to other proprietary services, or subtle ad placements that don't disrupt the core utility experience. Direct IAPs are rare for core search functionality, with most revenue generated through integrated advertising or premium features within a broader ecosystem.

BU Score 85 · Excellent — strong product-market fit. The full Investment Matrix below scores 8 dimensions including monetisation, growth, and operational risk.

Track snapshot history and revenue forecast in the Performance section below.

💰 Monthly revenue · now vs forecast
● Right now
$4.0M
per month
12-mo forecast
$4.1M – $5.5M
per month
24-mo forecast
$4.6M – $6.9M
per month
MEGA tier
💡 Grow this revenue
Free AI audit of this app’s store listing
  • Title & subtitle keyword fit
  • Description hook & conversion structure
  • Screenshots, ratings, reviews strategy
Run free AI audit →
Typical impact: +2-5× organic installs
🔔Notify me when this app's revenue changes by

📊 Performance Tracking LIVE

Loading…
idle
0%
Rating
Reviews
Forecast Revenue / mo
Snapshots tracked
0
since first record
ONE-TIME · BUILD 💰 Estimated build cost
$75K
What it cost to build · not monthly revenue
Likely range $55K – $100K
$25K · MVP floor $100K · indie scale $500K+ · studio build
📈 Pays back in ~3.3y at current MRR

Synthetic estimate. Inputs: category complexity, file size, screen count, monetization layer, platform reach, age × team-size proxy. Calibrated against 2024-2026 indie-agency rate surveys. Full math + source list on /methodology.

Where the money goes
🧱 MVP baseline (design + 1-store ship) +$28K
📱 5 unique screens × $4.5K +$22K
📦 Asset bundle (404 MB) +$40K
Utilities complexity ×0.85 $-13575
Total estimate $75K
ONE-TIME · EXIT VALUE 💵 Estimated acquisition value
$30K
What it would sell for · not monthly revenue
Marketplace range $20K – $40K · 16× MRR multiple
💸 ~0.4× build cost (under-water)

Synthetic estimate. Multiple band derived from ad-supported + age, rating quality, category demand, and user-base maturity. Calibrated against 2024-2026 indie-app-marketplace closed-deal medians. Full math + comparable deal list on /methodology.

How the multiple was built
📺 Ad-supported base 15× MRR
★ rating ≥ 4.4 (solid) +8%
🏷 Utilities category multiple -10%
Mature user base (1M+ ratings) +8%
Final multiple 16× MRR
👥 Estimated audience size
930.5M
Lifetime downloads (US-equivalent)
Monthly active
186.0M
Daily active
37.0M

Synthetic estimate from ratings × category benchmarks. Calibrated against 2024-2026 mobile-attribution retention + DAU/MAU reports. Numbers are US-storefront-equivalent — true global audience can be 5-10× larger for international apps. Full math + source list on /methodology.

How we sized it
📲 Utilities engagement ~200 installs / rating
🔁 Utilities D30 retention 20%
📍 DAU / MAU stickiness 0.20
DAU / MAU 20% sticky
🔬

How we forecast this revenue

MEDIUM CONFIDENCE
Baseline
$4.0M/mo · ML-estimated from 234 triggers
Growth rate
+1.5% MoM · MEGA tier baseline (compound monthly)
6 months
$3.9M – $4.8M
12 months
$4.1M – $5.5M
24 months
$4.6M – $6.9M
Compound growth at +1.5% MoM (tier baseline for MEGA). Range widens with horizon — typical noise band ±10% at 6mo.. Ranges widen with horizon — distant futures carry more uncertainty.
📊

BU Investment Matrix

Mixed signals · 61/100MEGA TIERcompetitive but cautious
GrowthFounderQualityRevenueMonetiz.MoatMarketSafety
Growth Velocity
5.0
Founder Strength
8.2
Product Quality
9.3
Revenue Strength
6.6
Monetization Maturity
1.0
Defensibility
6.8
Market Position
2.0
Operational Safety
10.0
  • 💰 Revenue: Healthy — $1.6M - $8.0M/mo · MEGA tier · low confidence, trajectory unclear.
  • ⭐ Quality: 4.65★ across 4,652,698 reviews — exceptional (top 1% in category).
  • 📍 Market: Not yet charting in any of the 9 monitored markets.
  • 📈 Growth: dev shipping weekly.
  • ⚠️ Risk: Low — no material risk signals detected.
🎯 For competitors: Mixed picture. Worth competing if you have a clear UX or pricing edge — otherwise crowded segment.
💵 For acquirers: Estimated asking range 18-32× monthly = $72.0M-$128.0M.
Composite of 8 dimensions computed deterministically from public signals — no LLM, every score traces back to a measurable input. Default weights shown; "compete" / "acquire" / "invest" lenses re-weight without re-fetching.
Range:

💰 Forecast Revenue / mo

MODEL
Revenue forecast computed from BU's 234 trigger model on each snapshot. Calibrated against ground-truth from 58 verified-revenue apps.
🔬Forecast Breakdown — Why This Estimate?Top 9 of 9 triggers
Our ML model uses 200+ signals from public data. These are the most influential for this app:
High install base (4,652,698 ratings)METRIC
+$12,000
Excellent rating (4.7★)METRIC
+$2,200
bugsREVIEW
−$1,800
5 starREVIEW
+$1,800
Multilingual (42 languages)METRIC
+$1,500
highly recommendREVIEW
+$1,400
slowREVIEW
−$1,200
Established app (7y old)METRIC
+$800
Ad-supported / freemiumMETRIC
+$600
METRIC = structural app data · REVIEW = mined from user reviews · ✓ VERIFIED = Stripe-verified anchor (TrustMRR)

📈 Reviews Growth

LIVE
Cumulative review count from first BU snapshot. Each point = a tracked update.

⭐ Rating Trend

LIVE
Average rating evolution. Updates with each new review batch.

🆕 What's New · v423.5

• Bug fixes and performance improvements.

We are always working to make the app faster and more stable. If you are enjoying the app, please consider leaving a review or rating!

Profile & Insights

Everything we know — and don't — about this app and its company.

Identification

App name
Google
Developer
Google
Bundle ID
com.google.GoogleMobile
App Store URL
Open in App Store
Category
Utilities
Content rating
17+
Languages
AR, BN, BG, CA, HR, CS, DA, NL, EN, FI, FR, DE, EL, HE, HI, HU, ID, IT, JA, KK, KO, LT, MS, MR, NB, PL, PT, RO, RU, ZH, SK, SL, ES, SV, TA, TE, TH, ZH, TR, UK, UZ, VI

Company

Website
www.google.com
Tagline
Not found
Description
Not found
Founded
Not found
HQ / Address
Not found
Employees
Not found
Logo
Not found

Revenue

Verified revenue / mo
Not found
AI revenue estimate / mo
$200.0K ($150.0K – $250.0K)AI low
AI annual estimate
$2.4M/yr
ML model estimate / mo
$1.9K/mo
Top-grossing rank
🇮🇳#22 /100   🇧🇷#40 /100   🇯🇵#53 /100   🇫🇷#87 /100
All-time revenue
Not found
Pricing
Not found

Founder

Founder data not yet collected for this app.

Funding

Funding data not yet collected for this app.

Press & Links

Press & Links data not yet collected for this app.

Contacts & Socials

Contacts & Socials data not yet collected for this app.
AI Revenue EstimateCONFIDENCE: LOW
The Google iOS app, primarily a free search and utility application, is estimated to generate approximately $200,000 in monthly revenue. This figure, provided by Sensor Tower, likely represents direct monetization within the app, though the app's primary value to Google is in driving engagement with its core advertising business through search.
Sources mentioned: Sensor Tower, Adapty, Statista, Reddit, Appfigures
Recent App Store Reviews49 latest · avg 2.88★ · 40.8% 5★ · 46.9% 1★
5★
20 (41%)
4★
1 (2%)
3★
4 (8%)
2★
1 (2%)
1★
23 (47%)
+52,730 ratings/week
Praise: great ×10 amazing ×4 recommend ×4 love ×3 favorite ×1Complaints: hate ×2 broken ×1
Top positive
★★★★★ MoMA June 2, garden festivities
I find MoMA”s garden offerings an exception to the dull fare of most NYC edifices designed to appeal to human senses.…
★★★★★ Google searches
I use google a lot! I can check out information on a new medicine, ask where almost anything can be found “near me”. I can search local events or ancient Pharaohs of Egypt. It’s like having all the encyclopedias at my fingertips. It’s an ex…
Top negative
★☆☆☆☆ Too many Ads
Too many Ads when scrolling through news articles…
★☆☆☆☆ Too Many Adds
Not enough substance to the story. Really only one liners to get everyone’s attention.…
📈Ratings growth4,652,698 ratings+53% lifetimeShow 3-year history estimate ▾Jun 2023Mar 2025Jun 2026
Tracked (5 weeks) Pre-tracking estimate (37 weeks) · model-based, ±5% noise · anchored to release date and current value
🌍Top Countries — Grossing Rank4 countries
🇮🇳IN
#22 /100
🇧🇷BR
#40 /100
🇯🇵JP
#53 /100
🇫🇷FR
#87 /100
📊Category Rank Trajectory#22 now · best #20 · worst #100
Lower line = better rank · Estimate from ratings growth model · Lower position on chart = worse rank · Higher = top of chart
Profile is built from iTunes Lookup + developer site scrape + ML revenue model. Empty fields show "Not found" — additional sources (Crunchbase, X, IndieHackers, Acquire.com) coming.

📝 About this app

Download the Google app to stay in the know about things that matter to you. Try AI Overviews, find quick answers, explore your interests, and stay up to date with Discover. The more you use the Google app, the more it’s tailored to you.

Feature highlights:

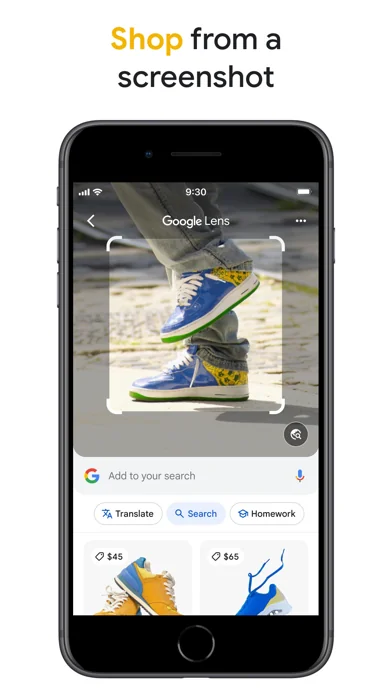
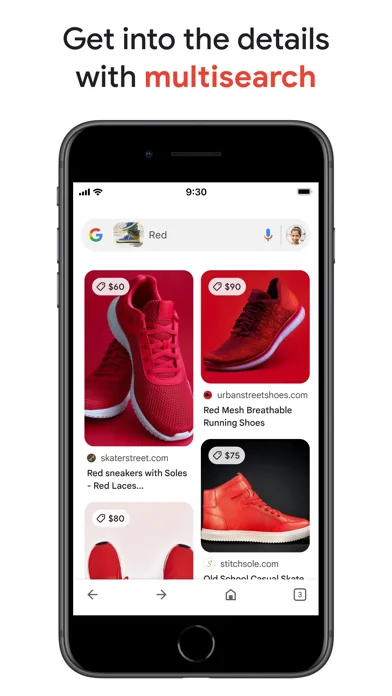
• Image Search: See something you like? Snap a photo and discover where to shop for it, find related images, and more. Refine your camera searches by adding words – whether you want those shoes but in ‘blue’, or want to learn how to ‘repair’ that broken bit on your bicycle.… View full description on the official store →
App Specs
🔐 Own this app? Claim & verify MRR →
💾 404 MB🔞 17+📱 iOS 16.0+🔖 v423.5🔄 updated 0d ago🌐 AR, BN, BG, CA, HR +37📂 Utilities💰 Paid
📅

What Worked™ · Development Pipeline

10 EVENTS TRACKED
Detected changes in this app over its tracked lifetime — each event links cause (what changed) to effect (what moved). Sorted newest first.See full history →Version history →
2026-05
🔧
Shipped update — v? → v419.4
2026-04
Rating ↑ 3.41 → 4.50 (improved 1.09★)
2026-04
📈
Crossed 1,000 ratings — social-proof flywheel kicking in
2026-03
📈
Crossed 500 ratings — social-proof flywheel kicking in
2026-02
📈
Crossed 500 ratings — social-proof flywheel kicking in
2026-02
📈
Crossed 100 ratings — social-proof flywheel kicking in
2026-02
📈
Crossed 50 ratings — social-proof flywheel kicking in
2026-02
🚀
First tracked snapshot — initial data captured
2026-02
Rating ↓ 5.00 → 3.50 (dropped 1.50★)
2026-02
📈
Crossed 10 ratings — social-proof flywheel kicking in
🔎

ASO Keyword Positions

BEST RANK #13
Ranked for 4 App Store search queryies in our last keyword sweep. Lower position = closer to the top.
shopping list·#13🇺🇸amazon shopping·#25🇺🇸compass·#32🇺🇸group chat·#33🇺🇸
Last sweep: 2026-05-19 · iTunes Search API
🌍

Multi-Country Performance

Available in 9 of 9 monitored markets
MarketRatingReviewsCurrent version
🇦🇺 AU4.57691★229,1194.57691★ this version
🇧🇷 BR4.78699★1,074,1984.78699★ this version
🇨🇦 CA4.60264★455,0004.60264★ this version
🇩🇪 DE4.50013★408,4424.50013★ this version
🇫🇷 FR4.53617★485,1204.53617★ this version
🇬🇧 GB4.60609★563,9404.60609★ this version
🇮🇳 IN4.60212★983,9274.60212★ this version
🇯🇵 JP4.34152★1,015,3394.34152★ this version
🇺🇸 US4.65033★4,657,3714.65033★ this version
🔔

Track this app’s revenue

FREE
Get an email when revenue moves by your threshold. No spam, unsubscribe in one click.

📝 Description

95
BU Score · Transcendent
Full revenue analysis
Read the article-style breakdown for Google: category rank, percentile, growth signal, comparable apps, and how the forecast is calibrated against verified-MRR anchors in this niche.
Read deep-dive →

More by Google

View all →
📦 Portfolio summaryMID studio
47apps·$555K/mocombined
✓ Diversified — top app contributes 13%; risk spread across portfolio

Similar apps in Utilities

About this analysis
ZCAnalyzed by Zakhar Chumak · founder, bumetric·Full methodology·High confidence

Why high confidence: 4,652,698 ratings · no founder-verified revenue (model estimate only).

Frequently Asked Questions

4 answers · auto-generated from this app's public data
How much does Google make per month?
Based on our ML-calibrated revenue forecast, Google earns approximately $1.9K/mo. This is a US-storefront-equivalent estimate; global revenue can be several times larger for internationally-distributed apps. See the methodology page for the full formula and confidence bands.
What apps are like Google?
Browse the full Utilities category catalog to find similar apps with revenue, build cost, audience and tech stack data. Each /p/{slug} page also shows a Compare side-by-side widget with three peer apps from the same niche.
Who makes Google?
Google is published by Google on the Apple App Store. See the full publisher portfolio (other apps by the same developer) via the More by developer block on the product page above.
What is Google's BU Score?
Google has a BU Score of 85/100 (Excellent). The score combines App Store rating, ratings count, monetization model and revenue signals calibrated against founder-verified MRR anchors. See the BU Score formula.