29K iOS Apps Tracked Updated 1 min ago Revenue Forecasts
Add an app Create Account Sign In
Home

Google Präsentationen

80
Quality Score
Excellent

Google Präsentationen

High confidence
4.7 ✍️ Editor
✍️ bumetric analysis

Google Präsentationen is an iOS app from Google in the Productivity category, currently rated 4.7★ across 397,088 ratings. Initial signal reads as mixed reviews: supporters praise core features while critics cite stability and value gaps.

Quality Score is 80: Excellent (strong product-market fit). For a Productivity app, that means strong product-market fit. The full BU Investment Matrix below scores 8 dimensions including monetisation, growth, and operational risk.

Track changes month-over-month in the Performance section below: live snapshot history and revenue forecast included.

💰 Monthly revenue · now vs forecast
● Right now
$1.5M
per month
12-mo forecast
$1.6M – $2.4M
per month
24-mo forecast
$1.9M – $3.5M
per month
BIG tier
💡 Grow this revenue
Free AI audit of this app’s store listing
  • Title & subtitle keyword fit
  • Description hook & conversion structure
  • Screenshots, ratings, reviews strategy
Run free AI audit →
Typical impact: +2-5× organic installs
🔔Notify me when this app's revenue changes by

📊 Performance Tracking LIVE

Loading…
idle
0%
Rating
Reviews
Forecast Revenue / mo
Snapshots tracked
0
since first record
ONE-TIME · BUILD 💰 Estimated build cost
$100K
What it cost to build · not monthly revenue
Likely range $75K – $135K
$25K · MVP floor $100K · indie scale $500K+ · studio build
📈 Pays back in ~2.1y at current MRR

Synthetic estimate. Inputs: category complexity, file size, screen count, monetization layer, platform reach, age × team-size proxy. Calibrated against 2024-2026 indie-agency rate surveys. Full math + source list on /methodology.

Where the money goes
🧱 MVP baseline (design + 1-store ship) +$28K
📱 5 unique screens × $4.5K +$22K
📦 Asset bundle (360 MB) +$40K
Productivity complexity ×1.10 +$9K
Total estimate $100K
ONE-TIME · EXIT VALUE 💵 Estimated acquisition value
$75K
What it would sell for · not monthly revenue
Marketplace range $50K – $100K · 18× MRR multiple
💸 ~0.8× build cost (under-water)

Synthetic estimate. Multiple band derived from ad-supported + age, rating quality, category demand, and user-base maturity. Calibrated against 2024-2026 indie-app-marketplace closed-deal medians. Full math + comparable deal list on /methodology.

How the multiple was built
📺 Ad-supported base 15× MRR
★ rating ≥ 4.4 (solid) +8%
🏷 Productivity category multiple +8%
Mature user base (100K+ ratings) +5%
Final multiple 18× MRR
👥 Estimated audience size
29.5M
Lifetime downloads (US-equivalent)
Monthly active
8.8M
Daily active
4.0M

Synthetic estimate from ratings × category benchmarks. Calibrated against 2024-2026 mobile-attribution retention + DAU/MAU reports. Numbers are US-storefront-equivalent — true global audience can be 5-10× larger for international apps. Full math + source list on /methodology.

How we sized it
📲 Productivity engagement ~75 installs / rating
🔁 Productivity D30 retention 30%
📍 DAU / MAU stickiness 0.45
DAU / MAU 45% sticky
🔬

How we forecast this revenue

MEDIUM CONFIDENCE
Baseline
$1.5M/mo · ML-estimated from 234 triggers
Growth rate
+2.5% MoM · BIG tier baseline (compound monthly)
6 months
$1.5M – $2.0M
12 months
$1.6M – $2.4M
24 months
$1.9M – $3.5M
Compound growth at +2.5% MoM (tier baseline for BIG). Range widens with horizon — typical noise band ±15% at 6mo.. Ranges widen with horizon — distant futures carry more uncertainty.
📊

BU Investment Matrix

Mixed signals · 62/100BIG TIERcompetitive but cautious
GrowthFounderQualityRevenueMonetiz.MoatMarketSafety
Growth Velocity
5.0
Founder Strength
8.2
Product Quality
9.3
Revenue Strength
6.2
Monetization Maturity
1.0
Defensibility
7.5
Market Position
2.0
Operational Safety
10.0
  • 💰 Revenue: Healthy — $600K - $3300K/mo · BIG tier · medium-low confidence, trajectory unclear.
  • ⭐ Quality: 4.67★ across 397,088 reviews — exceptional (top 1% in category).
  • 📍 Market: Not yet charting in any of the 9 monitored markets.
  • 📈 Growth: Insufficient signal to assess trajectory.
  • ⚠️ Risk: Low — no material risk signals detected.
🎯 For competitors: Mixed picture. Worth competing if you have a clear UX or pricing edge — otherwise crowded segment.
💵 For acquirers: Estimated asking range 18-32× monthly = $27.0M-$48.0M.
Composite of 8 dimensions computed deterministically from public signals — no LLM, every score traces back to a measurable input. Default weights shown; "compete" / "acquire" / "invest" lenses re-weight without re-fetching.
Range:

💰 Forecast Revenue / mo

MODEL
Revenue forecast computed from BU's 234 trigger model on each snapshot. Calibrated against ground-truth from 58 verified-revenue apps.
🔬Forecast Breakdown — Why This Estimate?Top 9 of 9 triggers
Our ML model uses 200+ signals from public data. These are the most influential for this app:
High install base (397,088 ratings)METRIC
+$12,000
Excellent rating (4.7★)METRIC
+$2,200
bugsREVIEW
−$1,800
5 starREVIEW
+$1,800
Mature app (11y old)METRIC
+$1,500
Multilingual (67 languages)METRIC
+$1,500
highly recommendREVIEW
+$1,400
slowREVIEW
−$1,200
Ad-supported / freemiumMETRIC
+$600
METRIC = structural app data · REVIEW = mined from user reviews · ✓ VERIFIED = Stripe-verified anchor (TrustMRR)

📈 Reviews Growth

LIVE
Cumulative review count from first BU snapshot. Each point = a tracked update.

⭐ Rating Trend

LIVE
Average rating evolution. Updates with each new review batch.

🆕 What's New · v1.2026.20100

* Security improvements, bug fixes, and performance improvements.

Profile & Insights

Everything we know — and don't — about this app and its company.

Identification

App name
Google Präsentationen
Developer
Google
Bundle ID
com.google.Slides
App Store URL
Open in App Store
Category
Productivity
Content rating
4+
Languages
AF, AM, AR, HY, AZ, EU, BE, BN, BG, KM, CA, HR, CS, DA, NL, EN, ET, FI, FR, GL, KA, DE, EL, GU, HE, HI, HU, IS, ID, IT, JA, KN, KK, KO, LO, LV, LT, MS, ML, MR, MN, NE, NB, OR, FA, PL, PT, PA, RO, RU, SR, ZH, SI, SK, SL, ES, SW, SV, TA, TE, TH, ZH, TR, UK, UR, VI, ZU

Company

Website
www.google.com
Tagline
Not found
Description
Not found
Founded
Not found
HQ / Address
Not found
Employees
Not found
Logo
Not found

Revenue

Verified revenue / mo
Not found
AI revenue estimate / mo
Not found
AI annual estimate
Not found
ML model estimate / mo
$4.0K/mo
Top-grossing rank
Outside top 100 in US Productivity
All-time revenue
Not found
Pricing
Not found

Founder

Founder data not yet collected for this app.

Funding

Funding data not yet collected for this app.

Press & Links

Press & Links data not yet collected for this app.

Contacts & Socials

Contacts & Socials data not yet collected for this app.
AI Revenue EstimateCONFIDENCE: HIGH
The iOS app "Google Präsentationen" (Google Slides) is a free productivity application with no direct in-app purchases or subscriptions. Its value is primarily derived from being part of the Google Workspace ecosystem, which offers advanced features to subscribers. Therefore, the app itself does not generate direct revenue.
Sources mentioned: Sensor Tower, Apple App Store, Google Play Store, Google Workspace
📈Ratings growth397,088 ratings+29% lifetimeShow 3-year history estimate ▾Jun 2023Jan 2026Jun 2026
Tracked (27 weeks) Pre-tracking estimate (37 weeks) · model-based, ±5% noise · anchored to release date and current value
🌍Geographic ReachNot ranked
This app is currently outside the top 100 grossing in all 9 countries we monitor (US, UK, DE, FR, JP, CA, AU, BR, IN). Niche or new apps often launch this way — popularity rankings appear once daily revenue clears the regional threshold.
Profile is built from iTunes Lookup + developer site scrape + ML revenue model. Empty fields show "Not found" — additional sources (Crunchbase, X, IndieHackers, Acquire.com) coming.

📝 About this app

Create, edit, and collaborate on presentations with the Google Slides app. With Slides you can:

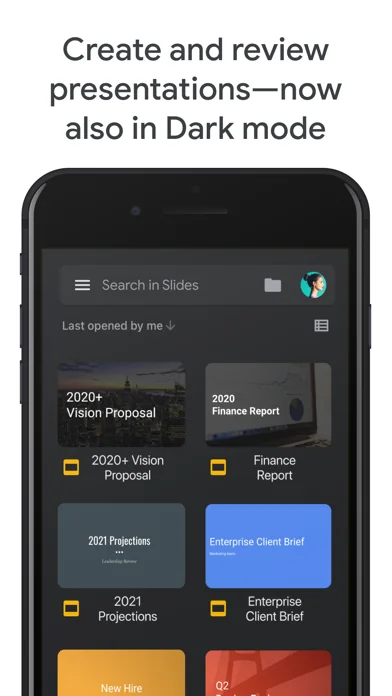
* Create new presentations or edit existing ones
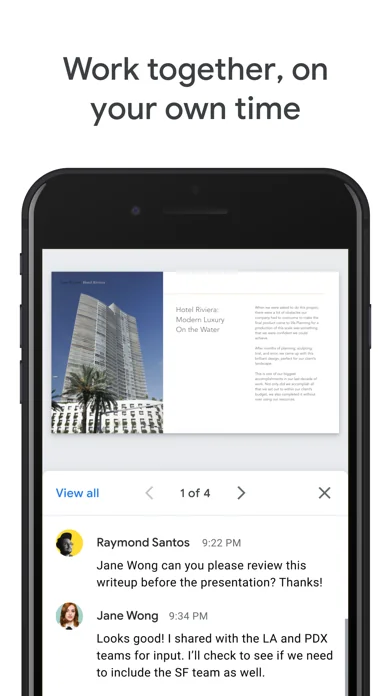
* Share presentations and collaborate with others in the same presentation at the same time
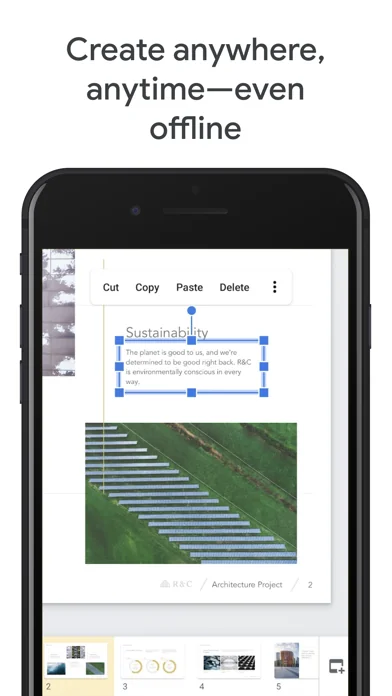
* Work anywhere, anytime - even offline
* Add and rearrange slides, format text and shapes, and more
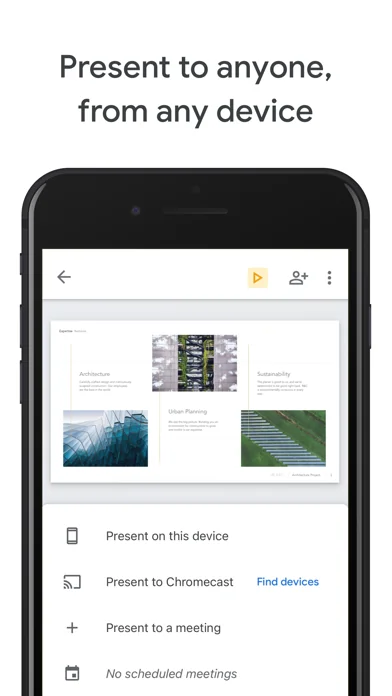
* Present right from your device
* Never worry about losing your work -- everything is automatically saved as you type
* Present slides to video calls - scheduled meetings will automatically appear
* Open, edit, and save PowerPoint files… View full description on the official store →
App Specs
🔐 Own this app? Claim & verify MRR →
💾 360 MB🔞 4+📱 iOS 17.0+🔖 v1.2026.20100🔄 updated 0d ago🌐 AF, AM, AR, HY, AZ +62📂 Productivity💰 Paid
📅

What Worked™ · Development Pipeline

10 EVENTS TRACKED
Detected changes in this app over its tracked lifetime — each event links cause (what changed) to effect (what moved). Sorted newest first.See full history →Version history →
2026-05
🔄
Monetization changed: freemium → free
2026-03
Rating ↑ 3.43 → 4.60 (improved 1.17★)
2026-03
📈
Crossed 1,000 ratings — social-proof flywheel kicking in
2026-03
📈
Crossed 500 ratings — social-proof flywheel kicking in
2025-03
📈
Crossed 100 ratings — social-proof flywheel kicking in
2025-02
📈
Crossed 50 ratings — social-proof flywheel kicking in
2025-01
📈
Crossed 10 ratings — social-proof flywheel kicking in
2025-01
Rating ↑ 3.67 → 4.00 (improved 0.33★)
2025-01
🚀
First tracked snapshot — initial data captured
2025-01
Rating ↓ 5.00 → 3.00 (dropped 2.00★)
🌍

Multi-Country Performance

Available in 9 of 9 monitored markets
MarketRatingReviewsCurrent version
🇦🇺 AU4.4823★14,8624.4823★ this version
🇧🇷 BR4.83175★43,6564.83175★ this version
🇨🇦 CA4.52457★38,8764.52457★ this version
🇩🇪 DE4.58503★8,6204.58503★ this version
🇫🇷 FR4.67311★16,1404.67311★ this version
🇬🇧 GB4.58015★22,6134.58015★ this version
🇮🇳 IN4.68767★25,9154.68767★ this version
🇯🇵 JP4.51574★35,9924.51574★ this version
🇺🇸 US4.6744★399,2074.6744★ this version
🔔

Track this app’s revenue

FREE
Get an email when revenue moves by your threshold. No spam, unsubscribe in one click.

📝 Description

95
BU Score · Transcendent
Full revenue analysis
Read the article-style breakdown for Google Präsentationen: category rank, percentile, growth signal, comparable apps, and how the forecast is calibrated against verified-MRR anchors in this niche.
Read deep-dive →

More by Google

View all →
📦 Portfolio summaryMID studio
47apps·$555K/mocombined
✓ Diversified — top app contributes 13%; risk spread across portfolio

Similar apps in Productivity

About this analysis
ZCAnalyzed by Zakhar Chumak · founder, bumetric·Full methodology·High confidence

Why high confidence: 397,088 ratings · no founder-verified revenue (model estimate only).

Frequently Asked Questions

4 answers · auto-generated from this app's public data
How much does Google Präsentationen make per month?
Based on our ML-calibrated revenue forecast, Google Präsentationen earns approximately $4.0K/mo. This is a US-storefront-equivalent estimate; global revenue can be several times larger for internationally-distributed apps. See the methodology page for the full formula and confidence bands.
What apps are like Google Präsentationen?
Browse the full Productivity category catalog to find similar apps with revenue, build cost, audience and tech stack data. Each /p/{slug} page also shows a Compare side-by-side widget with three peer apps from the same niche.
Who makes Google Präsentationen?
Google Präsentationen is published by Google on the Apple App Store. See the full publisher portfolio (other apps by the same developer) via the More by developer block on the product page above.
What is Google Präsentationen's BU Score?
Google Präsentationen has a BU Score of 80/100 (Excellent). The score combines App Store rating, ratings count, monetization model and revenue signals calibrated against founder-verified MRR anchors. See the BU Score formula.