29K iOS Apps Tracked Updated 5 min ago Revenue Forecasts
Add an app Create Account Sign In
Home

TP-Link Deco

83
Quality Score
Excellent

TP-Link Deco

High confidence
4.8 ✍️ Editor
✍️ bumetric analysis

TP-Link Deco is an iOS app from TP-Link Systems Inc. in the Utilities category, currently rated 4.8★ across 70,333 ratings. Initial signal reads as largely positive sentiment, users highlighting consistency and feature depth.

Quality Score is 83: Excellent (strong product-market fit). For a Utilities app, that means strong product-market fit. The full BU Investment Matrix below scores 8 dimensions including monetisation, growth, and operational risk.

Track changes month-over-month in the Performance section below: live snapshot history and revenue forecast included.

💰 Monthly revenue · now vs forecast
● Right now
$600K
per month
12-mo forecast
$635K – $978K
per month
24-mo forecast
$759K – $1410K
per month
BIG tier
💡 Grow this revenue
Free AI audit of this app’s store listing
  • Title & subtitle keyword fit
  • Description hook & conversion structure
  • Screenshots, ratings, reviews strategy
Run free AI audit →
Typical impact: +2-5× organic installs
🔔Notify me when this app's revenue changes by

📊 Performance Tracking LIVE

Loading…
idle
0%
Rating
Reviews
Forecast Revenue / mo
Snapshots tracked
0
since first record
ONE-TIME · BUILD 💰 Estimated build cost
$75K
What it cost to build · not monthly revenue
Likely range $55K – $100K
$25K · MVP floor $100K · indie scale $500K+ · studio build
📈 Pays back in ~3 months at current MRR

Synthetic estimate. Inputs: category complexity, file size, screen count, monetization layer, platform reach, age × team-size proxy. Calibrated against 2024-2026 indie-agency rate surveys. Full math + source list on /methodology.

Where the money goes
🧱 MVP baseline (design + 1-store ship) +$28K
📱 5 unique screens × $4.5K +$22K
📦 Asset bundle (578 MB) +$40K
Utilities complexity ×0.85 $-13575
Total estimate $75K
ONE-TIME · EXIT VALUE 💵 Estimated acquisition value
$325K
What it would sell for · not monthly revenue
Marketplace range $250K – $425K · 16× MRR multiple
💸 ~4.3× return on build cost

Synthetic estimate. Multiple band derived from ad-supported + age, rating quality, category demand, and user-base maturity. Calibrated against 2024-2026 indie-app-marketplace closed-deal medians. Full math + comparable deal list on /methodology.

How the multiple was built
📺 Ad-supported base 15× MRR
★ rating ≥ 4.7 (premium) +15%
🏷 Utilities category multiple -10%
Final multiple 16× MRR
👥 Estimated audience size
14.0M
Lifetime downloads (US-equivalent)
Monthly active
2.8M
Daily active
560K

Synthetic estimate from ratings × category benchmarks. Calibrated against 2024-2026 mobile-attribution retention + DAU/MAU reports. Numbers are US-storefront-equivalent — true global audience can be 5-10× larger for international apps. Full math + source list on /methodology.

How we sized it
📲 Utilities engagement ~200 installs / rating
🔁 Utilities D30 retention 20%
📍 DAU / MAU stickiness 0.20
DAU / MAU 20% sticky
🔬

How we forecast this revenue

MEDIUM CONFIDENCE
Baseline
$600K/mo · ML-estimated from 234 triggers
Growth rate
+2.5% MoM · BIG tier baseline (compound monthly)
6 months
$591K – $800K
12 months
$635K – $978K
24 months
$759K – $1.4M
Compound growth at +2.5% MoM (tier baseline for BIG). Range widens with horizon — typical noise band ±15% at 6mo.. Ranges widen with horizon — distant futures carry more uncertainty.
📊

BU Investment Matrix

Mixed signals · 60/100BIG TIERcompetitive but cautious
GrowthFounderQualityRevenueMonetiz.MoatMarketSafety
Growth Velocity
5.0
Founder Strength
7.4
Product Quality
9.7
Revenue Strength
5.8
Monetization Maturity
1.0
Defensibility
7.3
Market Position
2.0
Operational Safety
10.0
  • 💰 Revenue: Healthy — $240K - $1320K/mo · BIG tier · medium-low confidence, trajectory unclear.
  • ⭐ Quality: 4.85★ across 70,333 reviews — exceptional (top 1% in category).
  • 📍 Market: Not yet charting in any of the 9 monitored markets.
  • 📈 Growth: Insufficient signal to assess trajectory.
  • ⚠️ Risk: Low — no material risk signals detected.
🎯 For competitors: Mixed picture. Worth competing if you have a clear UX or pricing edge — otherwise crowded segment.
💵 For acquirers: Estimated asking range 18-32× monthly = $10.8M-$19.2M.
Composite of 8 dimensions computed deterministically from public signals — no LLM, every score traces back to a measurable input. Default weights shown; "compete" / "acquire" / "invest" lenses re-weight without re-fetching.
Range:

💰 Forecast Revenue / mo

MODEL
Revenue forecast computed from BU's 234 trigger model on each snapshot. Calibrated against ground-truth from 58 verified-revenue apps.
🔬Forecast Breakdown — Why This Estimate?Top 9 of 9 triggers
Our ML model uses 200+ signals from public data. These are the most influential for this app:
Mid install base (70,333 ratings)METRIC
+$5,500
Paid app ($0.00)METRIC
+$2,800
Excellent rating (4.8★)METRIC
+$2,200
worth every pennyREVIEW
+$2,000
excellent appREVIEW
+$1,500
Mature app (9y old)METRIC
+$1,500
Multilingual (29 languages)METRIC
+$1,500
highly recommendREVIEW
+$1,400
slowREVIEW
−$1,200
METRIC = structural app data · REVIEW = mined from user reviews · ✓ VERIFIED = Stripe-verified anchor (TrustMRR)

📈 Reviews Growth

LIVE
Cumulative review count from first BU snapshot. Each point = a tracked update.

⭐ Rating Trend

LIVE
Average rating evolution. Updates with each new review batch.

🆕 What's New · v3.10.384

Fixed some bugs and improved the stability.

Profile & Insights

Everything we know — and don't — about this app and its company.

Identification

App name
TP-Link Deco
Developer
TP-Link Systems Inc.
Bundle ID
com.tplink.aria
App Store URL
Open in App Store
Category
Utilities
Content rating
4+
Languages
AR, BG, CS, DA, NL, EN, FI, FR, DE, EL, HE, HU, IT, JA, KO, MS, NB, PL, PT, RO, RU, SK, ES, SV, TH, ZH, TR, UK, VI

Company

Website
Not found
Tagline
Today
Description
Find apps and games for iPhone, iPad, Mac, and more on the App Store.
Founded
Not found
HQ / Address
Not found
Employees
Not found
Logo
Available

Revenue

Verified revenue / mo
Not found
AI revenue estimate / mo
Not found
AI annual estimate
Not found
ML model estimate / mo
$21.4K/mo
Top-grossing rank
🇮🇳#53 /100   🇦🇺#62 /100   🇬🇧#88 /100   🇨🇦#96 /100
All-time revenue
Not found
Pricing
Not found

Founder

Founder data not yet collected for this app.

Funding

Funding data not yet collected for this app.

Press & Links

Press & Links data not yet collected for this app.

Contacts & Socials

Contacts & Socials data not yet collected for this app.
📈Ratings growth70,333 ratings+38% lifetimeShow 3-year history estimate ▾Jun 2023May 2025Jun 2026
Tracked (9 weeks) Pre-tracking estimate (37 weeks) · model-based, ±5% noise · anchored to release date and current value
🌍Top Countries — Grossing Rank4 countries
🇮🇳IN
#53 /100
🇦🇺AU
#62 /100
🇬🇧GB
#88 /100
🇨🇦CA
#96 /100
📊Category Rank Trajectory#53 now · best #49 · worst #100
Lower line = better rank · Estimate from ratings growth model · Lower position on chart = worse rank · Higher = top of chart
Profile is built from iTunes Lookup + developer site scrape + ML revenue model. Empty fields show "Not found" — additional sources (Crunchbase, X, IndieHackers, Acquire.com) coming.

📝 About this app

Welcome to the Deco App — the perfect way to set up your mesh WiFi in minutes and control your whole network.

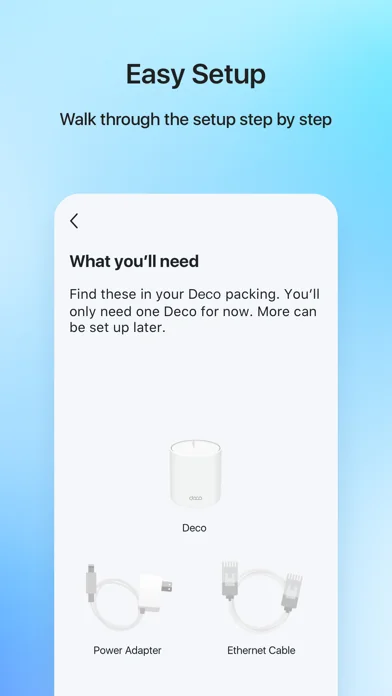
Our simple-to-follow guide walks you through the setup process and even gives you suggestions for whole home coverage.

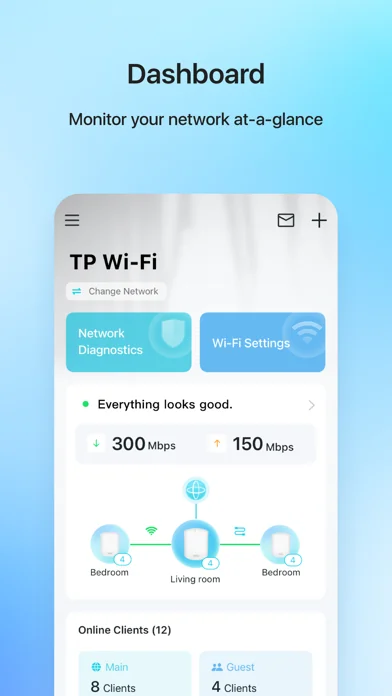
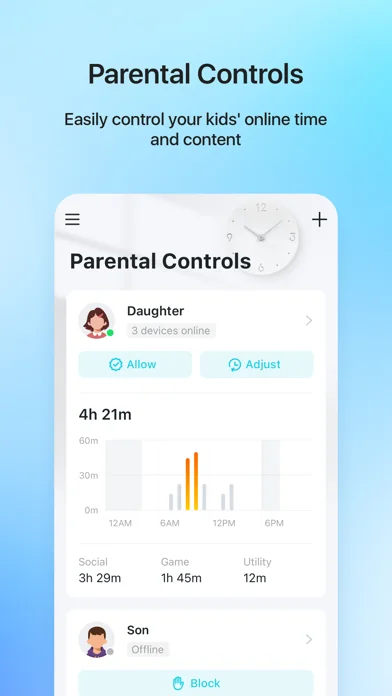
Once connected, you’ll have instant access to check every connected device, manage your kids’ online activity, and control your home network effortlessly. All from the palm of your hand.

- EASY TO SET UP AND MANAGE
• Quickly set up with step-by-step instructions
• Find the best spots to place additional Deco units for maximum coverage… View full description on the official store →
App Specs
🔐 Own this app? Claim & verify MRR →
💾 578 MB🔞 4+📱 iOS 13.0+🔖 v3.10.384🔄 updated 0d ago🌐 AR, BG, CS, DA, NL +24📂 Utilities💰 Paid
📅

What Worked™ · Development Pipeline

8 EVENTS TRACKED
Detected changes in this app over its tracked lifetime — each event links cause (what changed) to effect (what moved). Sorted newest first.See full history →Version history →
2026-05
📈
Crossed 1,000 ratings — social-proof flywheel kicking in
2026-03
📈
Crossed 500 ratings — social-proof flywheel kicking in
2026-03
📈
Crossed 500 ratings — social-proof flywheel kicking in
2026-01
📈
Crossed 100 ratings — social-proof flywheel kicking in
2026-01
📈
Crossed 50 ratings — social-proof flywheel kicking in
2026-01
📈
Crossed 10 ratings — social-proof flywheel kicking in
2026-01
Rating ↓ 5.00 → 4.67 (dropped 0.33★)
2025-12
🚀
First tracked snapshot — initial data captured
🌍

Multi-Country Performance

Available in 9 of 9 monitored markets
MarketRatingReviewsCurrent version
🇦🇺 AU4.82449★5,7554.82449★ this version
🇧🇷 BR4.90076★13,6344.90076★ this version
🇨🇦 CA4.80619★7,0124.80619★ this version
🇩🇪 DE4.81395★4,2574.81395★ this version
🇫🇷 FR4.76717★3,7714.76717★ this version
🇬🇧 GB4.7911★10,4504.7911★ this version
🇮🇳 IN4.87484★4,6184.87484★ this version
🇯🇵 JP4.7064★10,6304.7064★ this version
🇺🇸 US4.85386★72,6754.85386★ this version
🔔

Track this app’s revenue

FREE
Get an email when revenue moves by your threshold. No spam, unsubscribe in one click.

📝 Description

95
BU Score · Transcendent
Full revenue analysis
Read the article-style breakdown for TP-Link Deco: category rank, percentile, growth signal, comparable apps, and how the forecast is calibrated against verified-MRR anchors in this niche.
Read deep-dive →

More by TP-Link Systems Inc.

View all →
📦 Portfolio summaryINDIE studio
6apps·$71K/mocombined
✓ Diversified — top app contributes 43%; risk spread across portfolio

Similar apps in Utilities

About this analysis
ZCAnalyzed by Zakhar Chumak · founder, bumetric·Full methodology·High confidence

Why high confidence: 70,333 ratings · no founder-verified revenue (model estimate only).

Frequently Asked Questions

4 answers · auto-generated from this app's public data
How much does TP-Link Deco make per month?
Based on our ML-calibrated revenue forecast, TP-Link Deco earns approximately $21K/mo. This is a US-storefront-equivalent estimate; global revenue can be several times larger for internationally-distributed apps. See the methodology page for the full formula and confidence bands.
What apps are like TP-Link Deco?
Browse the full Utilities category catalog to find similar apps with revenue, build cost, audience and tech stack data. Each /p/{slug} page also shows a Compare side-by-side widget with three peer apps from the same niche.
Who makes TP-Link Deco?
TP-Link Deco is published by TP-Link Systems Inc. on the Apple App Store. See the full publisher portfolio (other apps by the same developer) via the More by developer block on the product page above.
What is TP-Link Deco's BU Score?
TP-Link Deco has a BU Score of 83/100 (Excellent). The score combines App Store rating, ratings count, monetization model and revenue signals calibrated against founder-verified MRR anchors. See the BU Score formula.