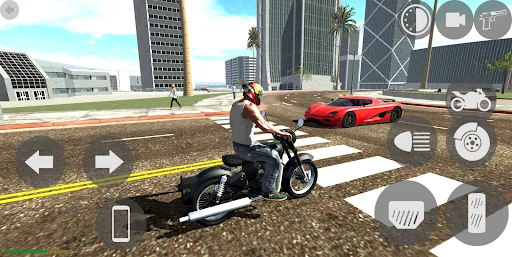
Indian Bikes Driving 3D


 78
78

Indian Bikes Driving 3D
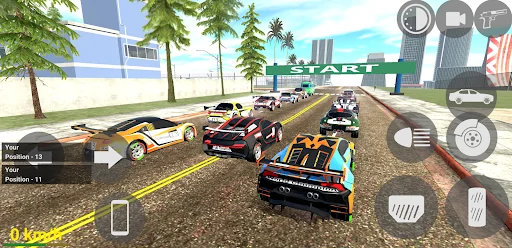
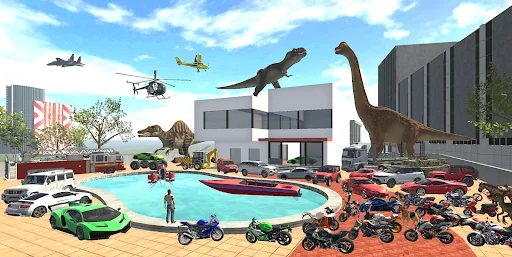
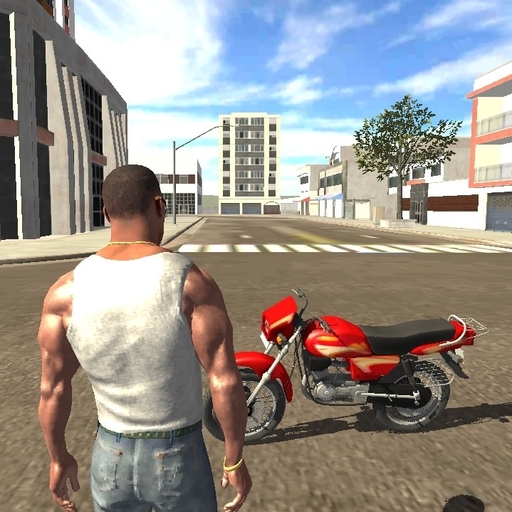
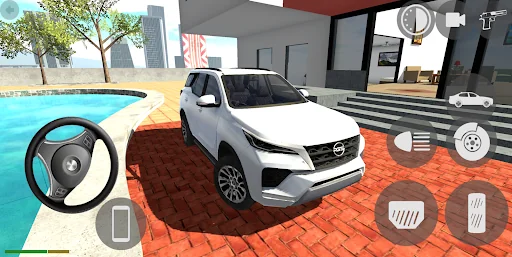
This Android simulation title from Rohit Gaming Studio carves out a distinct niche within the vehicle driving genre, specifically targeting players interested in a casual, open-world experience with a strong emphasis on cheat code discovery and a diverse vehicle/animal roster. It directly competes with other free-to-play driving simulators offering extensive vehicle customization and exploration, often from smaller, independent developers. The substantial volume of ratings, coupled with a solid average rating, indicates significant user traction and suggests the app is firmly in a mature growth phase, having successfully captured and retained a large audience. For simulation games like this, a common monetization strategy involves a balanced ad-IAP split, where rewarded video ads drive engagement and incremental revenue, while IAPs focus on cosmetic upgrades, vehicle unlocks, or ad removal to cater to different user segments.
BU Score 78 · Strong — healthy traction. The full Investment Matrix below scores 8 dimensions including monetisation, growth, and operational risk.
Track snapshot history and revenue forecast in the Performance section below.
- Title & subtitle keyword fit
- Description hook & conversion structure
- Screenshots, ratings, reviews strategy
📊 Performance Tracking LIVE
Synthetic estimate. Inputs: category complexity, file size, screen count, monetization layer, platform reach, age × team-size proxy. Calibrated against 2024-2026 indie-agency rate surveys. Full math + source list on /methodology.
| 🧱 MVP baseline (design + 1-store ship) | +$28K |
| 📱 5 unique screens × $4.5K | +$22K |
| ⚙ Simulation complexity ×2.00 | +$50K |
| 🌐 Cross-platform reach (iOS + Android) | +$55K |
Synthetic estimate. Multiple band derived from ad-supported + age, rating quality, category demand, and user-base maturity. Calibrated against 2024-2026 indie-app-marketplace closed-deal medians. Full math + comparable deal list on /methodology.
| 📺 Ad-supported base | 15× MRR |
| 🏷 Simulation category multiple | -10% |
| ⭐ Mature user base (1M+ ratings) | +8% |
Synthetic estimate from ratings × category benchmarks. Calibrated against 2024-2026 mobile-attribution retention + DAU/MAU reports. Numbers are US-storefront-equivalent — true global audience can be 5-10× larger for international apps. Full math + source list on /methodology.
| 📲 Simulation engagement | ~140 installs / rating |
| 🔁 Simulation D30 retention | 15% |
| 📍 DAU / MAU stickiness | 0.30 |
Heuristic guess from app bundle size, category, store description signals, and release-date stack era. Bumetric does not disassemble binaries — for binary-level certainty you would need an SDK intelligence tool or the manifest itself. Reasoning chain on the right. Full ruleset on /methodology.
| 🏷 Category context | Simulation |
| 📦 Tiny game bundle | → Native 2D engine |
How we forecast this revenue
MEDIUM CONFIDENCEBU Investment Matrix
Below median · 47/100MID TIERunderperforming peers- 💰 Revenue: Modest — $3K - $8K/mo · MID tier · medium confidence, trajectory unclear.
- ⭐ Quality: 4.14★ across 2,206,454 reviews — strong (top 10%).
- 📍 Market: Not yet charting in any of the 9 monitored markets.
- 📈 Growth: Insufficient signal to assess trajectory.
- ⚠️ Risk: Low — no material risk signals detected.
💰 Forecast Revenue / mo
MODEL| High install base (2,206,454 ratings)METRIC | +$12,000 | |
| Good rating (4.1★)METRIC | +$800 | |
| Established app (5y old)METRIC | +$800 | |
| Ad-supported / freemiumMETRIC | +$600 |
📈 Reviews Growth
LIVE⭐ Rating Trend
LIVEProfile & Insights
Identification
- App name
- Indian Bikes Driving 3D
- Developer
- Rohit Gaming Studio
- Bundle ID
- com.Rohit.IndianBikes
- App Store URL
- Open in App Store
- Category
- Simulation
- Content rating
- Not found
- Languages
- Not found
Company
- Website
- royalgamer4.blogspot.com
- Tagline
- Not found
- Description
- Not found
- Founded
- Not found
- HQ / Address
- Not found
- Employees
- Not found
- Logo
- Not found
Revenue
- Verified revenue / mo
- Not found
- AI revenue estimate / mo
- Not found
- AI annual estimate
- Not found
- ML model estimate / mo
- $5.6K/mo
- Top-grossing rank
- Not found
- All-time revenue
- Not found
- Pricing
- Not found
Founder
Funding
Press & Links
Contacts & Socials
📈Ratings growth2,206,454 ratings+58% lifetimeShow 3-year history estimate ▾
📝 About this app
Cellphone cheat codes:
RobotAi - 3380
Heicarrier - 12345
police Helicopter - 8001
Invisible Car - 1#
Mercedes AMG - 1391
Military Car - 3111
Bugatti - 8012
Bull Kart - 8011
Innova - 1207
Lam Urus - 3835
Dragon - 0701
Hot Air Balloon - 0601
Dragon - 0701
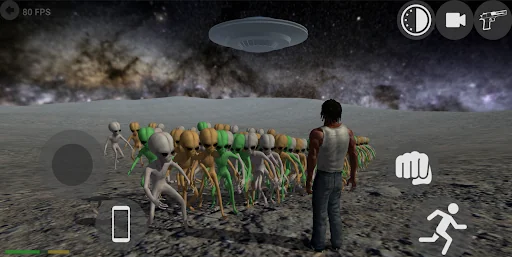
UFO - 0606
Land Cruiser - 1820
Defender - 0002
Buffalo - 6
Elephant - 10
G-Wagon - 6666
Tractor - 5643
Rickshaw - 8370
GTR - 3005
Boat - 3001
Thar - 9191
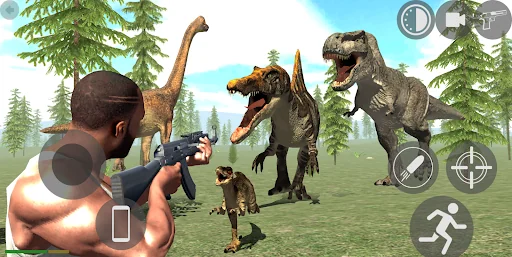
Velociraptor - 50
T-rex - 51
Spino - 52… View full description on the official store →
What Worked™ · Development Pipeline
3 EVENTS TRACKEDStore Page History
6 SCREENSHOT CHANGES2 ver.

2 ver.

2 ver.

2 ver.
2 ver.
2 ver.
Track this app’s revenue
FREE📝 Description
95
More by Rohit Gaming Studio
View all →


Why high confidence: 2,206,454 ratings · no founder-verified revenue (model estimate only).