How it Works: HK G3
 60
60

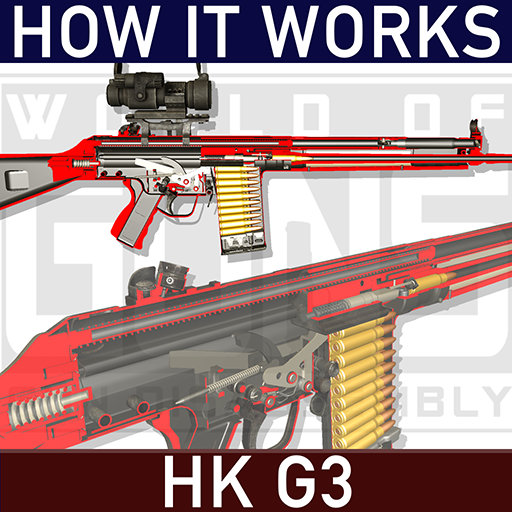
How it Works: HK G3
How it Works: HK G3 is an Android app from Noble Empire in the Simulation category, currently rated 4.9★ across 138 ratings. Initial signal reads as mixed reviews: supporters praise core features while critics cite stability and value gaps.
Quality Score is 60: Solid (established niche player). For a Simulation app, that means established niche player. The full BU Investment Matrix below scores 8 dimensions including monetisation, growth, and operational risk.
Track changes month-over-month in the Performance section below: live snapshot history and revenue forecast included.
- Title & subtitle keyword fit
- Description hook & conversion structure
- Screenshots, ratings, reviews strategy
📊 Performance Tracking LIVE
Synthetic estimate. Inputs: category complexity, file size, screen count, monetization layer, platform reach, age × team-size proxy. Calibrated against 2024-2026 indie-agency rate surveys. Full math + source list on /methodology.
| 🧱 MVP baseline (design + 1-store ship) | +$28K |
| 📱 5 unique screens × $4.5K | +$22K |
| ⚙ Simulation complexity ×2.00 | +$50K |
| 🌐 Cross-platform reach (iOS + Android) | +$55K |
Synthetic estimate from ratings × category benchmarks. Calibrated against 2024-2026 mobile-attribution retention + DAU/MAU reports. Numbers are US-storefront-equivalent — true global audience can be 5-10× larger for international apps. Full math + source list on /methodology.
| 📲 Simulation engagement | ~140 installs / rating |
| 🔁 Simulation D30 retention | 15% |
| 📍 DAU / MAU stickiness | 0.30 |
Heuristic guess from app bundle size, category, store description signals, and release-date stack era. Bumetric does not disassemble binaries — for binary-level certainty you would need an SDK intelligence tool or the manifest itself. Reasoning chain on the right. Full ruleset on /methodology.
| 🏷 Category context | Simulation |
| 📦 Tiny game bundle | → Native 2D engine |
How we forecast this revenue
MEDIUM CONFIDENCEBU Investment Matrix
Below median · 47/100MID TIERunderperforming peers- 💰 Revenue: Modest — $3K - $7K/mo · MID tier · medium confidence, trajectory unclear.
- ⭐ Quality: 4.89★ across 138 reviews — solid.
- 📍 Market: Not yet charting in any of the 9 monitored markets.
- 📈 Growth: ⚠ last update 3068d ago — possibly dormant.
- ⚠️ Risk: Moderate — dormant (3068d since update).
💰 Forecast Revenue / mo
MODEL| Excellent rating (4.9★)METRIC | +$2,200 | |
| Mature app (8y old)METRIC | +$1,500 | |
| Ad-supported / freemiumMETRIC | +$600 | |
| Early-stage install base (138 ratings)METRIC | +$400 |
📈 Reviews Growth
LIVE⭐ Rating Trend
LIVEProfile & Insights
Identification
- App name
- How it Works: HK G3
- Developer
- Noble Empire
- Bundle ID
- com.nobleempire.hk_g3
- App Store URL
- Open in App Store
- Category
- Simulation
- Content rating
- Not found
- Languages
- Not found
Company
- Website
- noble-empire.com
- Tagline
- Not found
- Description
- Not found
- Founded
- Not found
- HQ / Address
- Not found
- Employees
- Not found
- Logo
- Not found
Revenue
- Verified revenue / mo
- Not found
- AI revenue estimate / mo
- Not found
- AI annual estimate
- Not found
- ML model estimate / mo
- $259/mo
- Top-grossing rank
- Not found
- All-time revenue
- Not found
- Pricing
- Not found
Founder
Funding
Press & Links
Contacts & Socials
📈Ratings growth138 ratings+41% lifetimeShow 3-year history estimate ▾
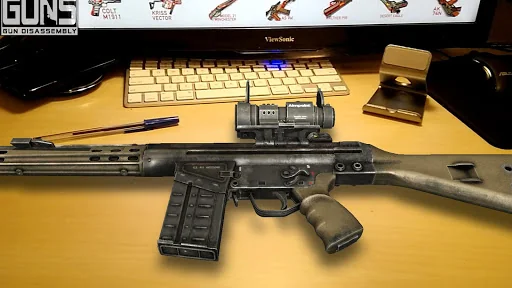
📝 About this app
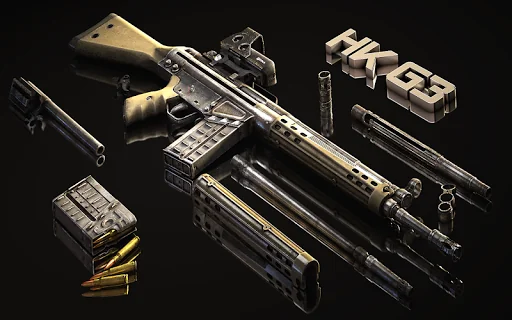
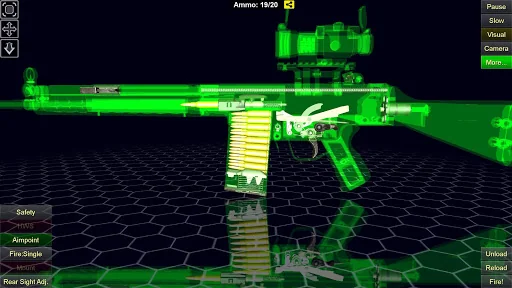
What is inside the gun app?!
- High detailed 3D model
- Operation animations: fire, unload, reload, safety
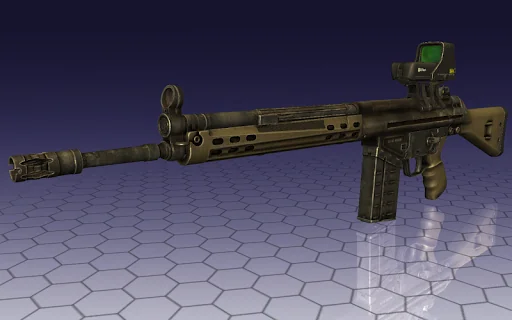
- Accessories: Picatinny Rail, HWS, Aimpoint, Rear Sight Adj.
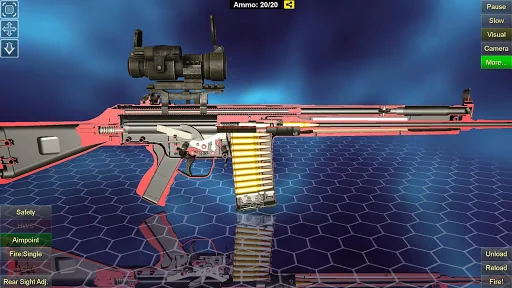
- Slow motion
- X-ray mode
- Cutaway mode
- Tap'n'Hide mode (hide any part of the model, just tap it)
- Augmented reality (use your camera to take AR photos)
Tech & Domain Intel — noble-empire.com
- Tech stack
- AWS SES · Google Workspace · Meta (Facebook) Ads
Track this app’s revenue
FREE📝 Description
95
More by Noble Empire
View all →


Why medium confidence: 138 ratings · no founder-verified revenue (model estimate only).