29K iOS Apps Tracked Updated 2 min ago Revenue Forecasts
Add an app Create Account Sign In
Home

YouTube

95
Quality Score
Transcendent

YouTube

High confidence
4.7 ✍️ Editor
✍️ bumetric analysis

This iOS app dominates the mobile video consumption and creation niche, directly competing with platforms like TikTok, Vimeo, and even traditional broadcast media for user attention. Its substantial rating, backed by tens of millions of reviews, signals immense user traction and a deeply entrenched position as a mature, market-leading product. The reported monthly revenue, while seemingly modest for its scale, reflects a free monetization model likely driven by advertising rather than direct in-app purchases. For the Photo & Video category, a common monetization observation is the reliance on subscription models for premium features, ad-free experiences, or creator tools, often yielding higher ARPU than pure ad-supported free apps. This app’s strategy prioritizes reach and engagement, leveraging its massive user base for ad inventory, a model that contrasts with the direct consumer spend seen in many niche video editing or streaming services.

BU Score 95 · Transcendent — category-leading momentum. The full Investment Matrix below scores 8 dimensions including monetisation, growth, and operational risk.

Track snapshot history and revenue forecast in the Performance section below.

💰 Monthly revenue · now vs forecast
● Right now
$6.0M
per month
12-mo forecast
$6.2M – $8.2M
per month
24-mo forecast
$6.9M – $10.3M
per month
MEGA tier
💡 Grow this revenue
Free AI audit of this app’s store listing
  • Title & subtitle keyword fit
  • Description hook & conversion structure
  • Screenshots, ratings, reviews strategy
Run free AI audit →
Typical impact: +2-5× organic installs
🔔Notify me when this app's revenue changes by

📊 Performance Tracking LIVE

Loading…
idle
0%
Rating
Reviews
Forecast Revenue / mo
Snapshots tracked
0
since first record
ONE-TIME · BUILD 💰 Estimated build cost
$140K
What it cost to build · not monthly revenue
Likely range $105K – $190K
$25K · MVP floor $100K · indie scale $500K+ · studio build
📈 Pays back in ~4 months at current MRR

Synthetic estimate. Inputs: category complexity, file size, screen count, monetization layer, platform reach, age × team-size proxy. Calibrated against 2024-2026 indie-agency rate surveys. Full math + source list on /methodology.

Where the money goes
🧱 MVP baseline (design + 1-store ship) +$28K
📱 5 unique screens × $4.5K +$22K
📦 Asset bundle (348 MB) +$40K
Photo & Video complexity ×1.55 +$49K
Total estimate $140K
ONE-TIME · EXIT VALUE 💵 Estimated acquisition value
$600K
What it would sell for · not monthly revenue
Marketplace range $475K – $800K · 18× MRR multiple
💸 ~4.3× return on build cost

Synthetic estimate. Multiple band derived from ad-supported + age, rating quality, category demand, and user-base maturity. Calibrated against 2024-2026 indie-app-marketplace closed-deal medians. Full math + comparable deal list on /methodology.

How the multiple was built
📺 Ad-supported base 15× MRR
★ rating ≥ 4.4 (solid) +8%
Mature user base (1M+ ratings) +8%
Final multiple 18× MRR
👥 Estimated audience size
6654.5M
Lifetime downloads (US-equivalent)
Monthly active
1197.5M
Daily active
359.0M

Synthetic estimate from ratings × category benchmarks. Calibrated against 2024-2026 mobile-attribution retention + DAU/MAU reports. Numbers are US-storefront-equivalent — true global audience can be 5-10× larger for international apps. Full math + source list on /methodology.

How we sized it
📲 Photo & Video engagement ~140 installs / rating
🔁 Photo & Video D30 retention 18%
📍 DAU / MAU stickiness 0.30
DAU / MAU 30% sticky
🔬

How we forecast this revenue

MEDIUM CONFIDENCE
Baseline
$6.0M/mo · ML-estimated from 234 triggers
Growth rate
+1.5% MoM · MEGA tier baseline (compound monthly)
6 months
$5.9M – $7.2M
12 months
$6.2M – $8.2M
24 months
$6.9M – $10.3M
Compound growth at +1.5% MoM (tier baseline for MEGA). Range widens with horizon — typical noise band ±10% at 6mo.. Ranges widen with horizon — distant futures carry more uncertainty.
📊

BU Investment Matrix

Mixed signals · 62/100MEGA TIERcompetitive but cautious
GrowthFounderQualityRevenueMonetiz.MoatMarketSafety
Growth Velocity
5.0
Founder Strength
8.2
Product Quality
9.3
Revenue Strength
6.8
Monetization Maturity
1.0
Defensibility
7.5
Market Position
2.0
Operational Safety
10.0
  • 💰 Revenue: Healthy — $2.4M - $12.0M/mo · MEGA tier · low confidence, trajectory unclear.
  • ⭐ Quality: 4.67★ across 47,532,659 reviews — exceptional (top 1% in category).
  • 📍 Market: Not yet charting in any of the 9 monitored markets.
  • 📈 Growth: dev shipping weekly.
  • ⚠️ Risk: Low — no material risk signals detected.
🎯 For competitors: Mixed picture. Worth competing if you have a clear UX or pricing edge — otherwise crowded segment.
💵 For acquirers: Estimated asking range 18-32× monthly = $108.0M-$192.0M.
Composite of 8 dimensions computed deterministically from public signals — no LLM, every score traces back to a measurable input. Default weights shown; "compete" / "acquire" / "invest" lenses re-weight without re-fetching.
Range:

💰 Forecast Revenue / mo

MODEL
Revenue forecast computed from BU's 234 trigger model on each snapshot. Calibrated against ground-truth from 58 verified-revenue apps.
🔬Forecast Breakdown — Why This Estimate?Top 12 of 12 triggers
Our ML model uses 200+ signals from public data. These are the most influential for this app:
High install base (47,532,659 ratings)METRIC
+$12,000
subscriptionREVIEW
+$2,500
premiumREVIEW
+$2,200
Excellent rating (4.7★)METRIC
+$2,200
bugsREVIEW
−$1,800
5 starREVIEW
+$1,800
Mature app (13y old)METRIC
+$1,500
Multilingual (72 languages)METRIC
+$1,500
slowREVIEW
−$1,200
annoying adsREVIEW
−$1,100
too expensiveREVIEW
−$1,000
Ad-supported / freemiumMETRIC
+$600
METRIC = structural app data · REVIEW = mined from user reviews · ✓ VERIFIED = Stripe-verified anchor (TrustMRR)

📈 Reviews Growth

LIVE
Cumulative review count from first BU snapshot. Each point = a tracked update.

⭐ Rating Trend

LIVE
Average rating evolution. Updates with each new review batch.

🆕 What's New · v21.22.04

Bug fixes, performance improvements, and more cat videos.

Profile & Insights

Everything we know — and don't — about this app and its company.

Identification

App name
YouTube
Developer
Google
Bundle ID
com.google.ios.youtube
App Store URL
Open in App Store
Category
Photo & Video
Content rating
12+
Languages
AF, SQ, AM, AR, HY, AZ, EU, BE, BN, BS, BG, MY, KM, CA, HR, CS, DA, NL, EN, ET, FI, FR, GL, KA, DE, EL, GU, HE, HI, HU, IS, ID, IT, JA, KN, KK, KO, KY, LO, LV, LT, MK, MS, ML, MR, MN, NE, NB, FA, PL, PT, PA, RO, RU, SR, ZH, SI, SK, SL, ES, SW, SV, TA, TE, TH, ZH, TR, UK, UR, UZ, VI, ZU

Company

Website
www.youtube.com
Tagline
YouTube
Description
Auf YouTube findest du die angesagtesten Videos und Tracks. Außerdem kannst du eigene Inhalte hochladen und mit Freunden oder gleich der ganzen Welt teilen.
Founded
Not found
HQ / Address
Not found
Employees
Not found
Logo
Available

Revenue

Verified revenue / mo
Not found
AI revenue estimate / mo
$190.0M ($175.0M – $190.0M)AI high
AI annual estimate
$2280.0M/yr
ML model estimate / mo
$36.7K/mo
Top-grossing rank
🇺🇸#1 /100   🇬🇧#1 /100   🇩🇪#1 /100   🇯🇵#1 /100   🇨🇦#1 /100   🇦🇺#1 /100   🇧🇷#1 /100
All-time revenue
Not found
Pricing
Not found

Founder

Founder data not yet collected for this app.

Funding

Funding data not yet collected for this app.

Press & Links

Press & Links data not yet collected for this app.

Contacts & Socials

Socials
facebook facebook.com/youtube/?ref=br_r · instagram instagram.com/youtube · twitter twitter.com/YouTube · youtube tv.youtube.com/learn/nflsundayticket
Email
Not found
Phone
Not found
Contact page
youtube.com/t/contact_us
About page
youtube.com/about
AI Revenue EstimateCONFIDENCE: HIGH
The iOS app "YouTube" by Google is estimated to generate approximately $190 million in monthly revenue. This is based on recent Sensor Tower estimates for April 2026. Annually, this projects to about $2.28 billion, which aligns with the reported $2.1 billion in-app revenue for the iOS app in 2025, making it the top-grossing iOS app that year.
Sources mentioned: Sensor Tower, Business of Apps, Statista, DemandSage, Resourcera, Marketing Dive
📈Ratings growth47,532,659 ratings+12% lifetimeShow 3-year history estimate ▾
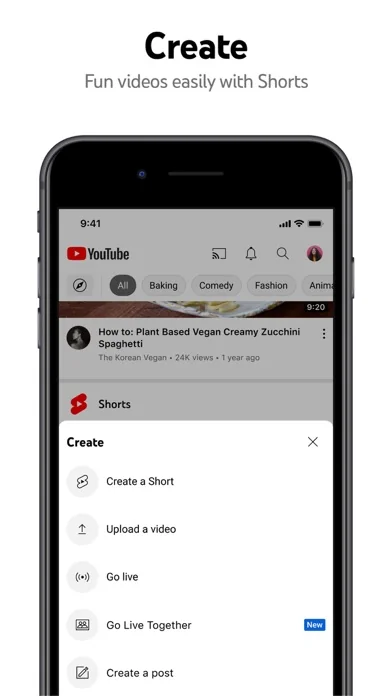
Jun 2023Feb 2025Jun 2026
Tracked (3 weeks) Pre-tracking estimate (37 weeks) · model-based, ±5% noise · anchored to release date and current value
🌍Top Countries — Grossing Rank9 countries
🇺🇸US
#1 /100
🇬🇧GB
#1 /100
🇩🇪DE
#1 /100
🇯🇵JP
#1 /100
🇨🇦CA
#1 /100
🇦🇺AU
#1 /100
🇧🇷BR
#1 /100
🇮🇳IN
#1 /100
🇫🇷FR
#2 /100
📊Category Rank Trajectory#1 now · best #1 · worst #100
Lower line = better rank · Estimate from ratings growth model · Lower position on chart = worse rank · Higher = top of chart
Profile is built from iTunes Lookup + developer site scrape + ML revenue model. Empty fields show "Not found" — additional sources (Crunchbase, X, IndieHackers, Acquire.com) coming.

📝 About this app

Get the official YouTube app on iPhones and iPads. See what the world is watching -- from the hottest music videos to what’s popular in gaming, fashion, beauty, news, learning and more. Subscribe to channels you love, create content of your own, share with friends, and watch on any device.

Watch and subscribe
● Browse personal recommendations on Home
● See the latest from your favorite channels in Subscriptions
● Look up videos you’ve watched, liked, and saved for later in Library

Explore different topics, what’s popular, and on the rise (available in select countries)… View full description on the official store →
App Specs
🔐 Own this app? Claim & verify MRR →
💾 348 MB🔞 12+📱 iOS 16.0+🔖 v21.22.04🔄 updated 0d ago🌐 AF, SQ, AM, AR, HY +67📂 Photo & Video💰 Paid
📅

What Worked™ · Development Pipeline

8 EVENTS TRACKED
Detected changes in this app over its tracked lifetime — each event links cause (what changed) to effect (what moved). Sorted newest first.See full history →Version history →
2026-05
🔧
Shipped update — v? → v21.18.4
2026-04
Rating ↑ 3.24 → 4.50 (improved 1.26★)
2026-04
📈
Crossed 1,000 ratings — social-proof flywheel kicking in
2026-03
📈
Crossed 500 ratings — social-proof flywheel kicking in
2026-03
📈
Crossed 100 ratings — social-proof flywheel kicking in
2026-03
🚀
First tracked snapshot — initial data captured
2026-03
Rating ↓ 2.00 → 1.67 (dropped 0.33★)
2026-03
📈
Crossed 10 ratings — social-proof flywheel kicking in
🧪

Tech & Domain Intel — youtube.com

Mail provider
Google Workspace
Tech stack
Google Workspace · Meta (Facebook) Ads
Derived from public RDAP + DNS TXT records (no scraping, no login).
🌍

Multi-Country Performance

Available in 9 of 9 monitored markets
MarketRatingReviewsCurrent version
🇦🇺 AU4.62727★2,624,4304.62727★ this version
🇧🇷 BR4.74721★7,042,4424.74721★ this version
🇨🇦 CA4.61527★4,097,2054.61527★ this version
🇩🇪 DE4.53681★3,787,0104.53681★ this version
🇫🇷 FR4.58914★4,508,3994.58914★ this version
🇬🇧 GB4.63821★6,018,8524.63821★ this version
🇮🇳 IN4.59042★8,192,3844.59042★ this version
🇯🇵 JP4.54107★9,645,1384.54107★ this version
🇺🇸 US4.67188★47,551,9764.67188★ this version
🔔

Track this app’s revenue

FREE
Get an email when revenue moves by your threshold. No spam, unsubscribe in one click.

📝 Description

95
BU Score · Transcendent
Full revenue analysis
Read the article-style breakdown for YouTube: category rank, percentile, growth signal, comparable apps, and how the forecast is calibrated against verified-MRR anchors in this niche.
Read deep-dive →

More by Google

View all →
📦 Portfolio summaryMID studio
47apps·$555K/mocombined
✓ Diversified — top app contributes 13%; risk spread across portfolio

Similar apps in Photo & Video

About this analysis
ZCAnalyzed by Zakhar Chumak · founder, bumetric·Full methodology·High confidence

Why high confidence: 47,532,659 ratings · no founder-verified revenue (model estimate only).

Frequently Asked Questions

4 answers · auto-generated from this app's public data
How much does YouTube make per month?
Based on our ML-calibrated revenue forecast, YouTube earns approximately $36K/mo. This is a US-storefront-equivalent estimate; global revenue can be several times larger for internationally-distributed apps. See the methodology page for the full formula and confidence bands.
What apps are like YouTube?
Browse the full Photo & Video category catalog to find similar apps with revenue, build cost, audience and tech stack data. Each /p/{slug} page also shows a Compare side-by-side widget with three peer apps from the same niche.
Who makes YouTube?
YouTube is published by Google on the Apple App Store. See the full publisher portfolio (other apps by the same developer) via the More by developer block on the product page above.
What is YouTube's BU Score?
YouTube has a BU Score of 95/100 (Transcendent). The score combines App Store rating, ratings count, monetization model and revenue signals calibrated against founder-verified MRR anchors. See the BU Score formula.