


 94
94


This iOS app dominates the mobile social sharing niche, specifically focused on visual content and short-form video. Its direct competitors include TikTok for video, and Snapchat for ephemeral sharing, though its broad feature set positions it against a wider array of social platforms. The exceptionally high volume of user ratings, coupled with a strong average score, signals enduring, massive user traction and a mature, established growth stage. This isn't a new entrant; it's a platform with sustained engagement. For the Photo & Video category, a common monetization observation is the strong performance of in-app advertising, often integrated natively within content feeds. Given this app's free model and vast user base, its ad revenue potential is substantial, with a typical ad-to-IAP split heavily favoring ad impressions over direct user purchases in this specific social sub-segment.
BU Score 94 · Transcendent — category-leading momentum. The full Investment Matrix below scores 8 dimensions including monetisation, growth, and operational risk.
Track snapshot history and revenue forecast in the Performance section below.
- Title & subtitle keyword fit
- Description hook & conversion structure
- Screenshots, ratings, reviews strategy
📊 Performance Tracking LIVE

Synthetic estimate. Inputs: category complexity, file size, screen count, monetization layer, platform reach, age × team-size proxy. Calibrated against 2024-2026 indie-agency rate surveys. Full math + source list on /methodology.
| 🧱 MVP baseline (design + 1-store ship) | +$28K |
| 📱 5 unique screens × $4.5K | +$22K |
| 📦 Asset bundle (549 MB) | +$40K |
| ⚙ Photo & Video complexity ×1.55 | +$49K |
Synthetic estimate. Multiple band derived from ad-supported + age, rating quality, category demand, and user-base maturity. Calibrated against 2024-2026 indie-app-marketplace closed-deal medians. Full math + comparable deal list on /methodology.
| 📺 Ad-supported base | 15× MRR |
| ⭐ ★ rating ≥ 4.4 (solid) | +8% |
| ⭐ Mature user base (1M+ ratings) | +8% |
Synthetic estimate from ratings × category benchmarks. Calibrated against 2024-2026 mobile-attribution retention + DAU/MAU reports. Numbers are US-storefront-equivalent — true global audience can be 5-10× larger for international apps. Full math + source list on /methodology.
| 📲 Photo & Video engagement | ~140 installs / rating |
| 🔁 Photo & Video D30 retention | 18% |
| 📍 DAU / MAU stickiness | 0.30 |
How we forecast this revenue
MEDIUM CONFIDENCEBU Investment Matrix
Mixed signals · 57/100BIG TIERcompetitive but cautious- 💰 Revenue: Healthy — $360K - $1980K/mo · BIG tier · medium-low confidence, trajectory unclear.
- ⭐ Quality: 4.69★ across 29,124,643 reviews — exceptional (top 1% in category).
- 📍 Market: Not yet charting in any of the 9 monitored markets.
- 📈 Growth: dev shipping weekly.
- ⚠️ Risk: Low — no material risk signals detected.
💰 Forecast Revenue / mo
MODEL| High install base (29,124,643 ratings)METRIC | +$12,000 | |
| Excellent rating (4.7★)METRIC | +$2,200 | |
| bugsREVIEW | −$1,800 | |
| 5 starREVIEW | +$1,800 | |
| Mature app (15y old)METRIC | +$1,500 | |
| Multilingual (31 languages)METRIC | +$1,500 | |
| slowREVIEW | −$1,200 | |
| Ad-supported / freemiumMETRIC | +$600 |
📈 Reviews Growth
LIVE⭐ Rating Trend
LIVE🆕 What's New · v432.0.0
Profile & Insights
Identification
- App name
- Developer
- Instagram, Inc.
- Bundle ID
- com.burbn.instagram
- App Store URL
- Open in App Store
- Category
- Photo & Video
- Content rating
- 12+
- Languages
- HR, CS, DA, NL, EN, FI, FR, DE, EL, HI, HU, ID, IT, JA, KO, MS, NB, PL, PT, RO, RU, ZH, SK, ES, SV, TL, TH, ZH, TR, UK, VI
Company
- Website
- instagram.com
- Tagline
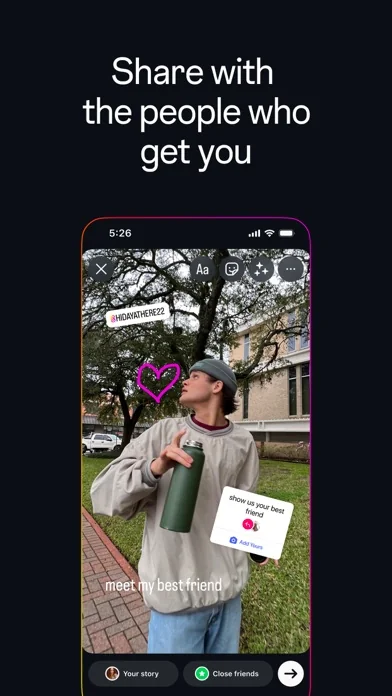
- Description
- Create an account or log in to Instagram - Share what you're into with the people who get you.
- Founded
- Not found
- HQ / Address
- Not found
- Employees
- Not found
- Logo
- Available
Revenue
- Verified revenue / mo
- Not found
- AI revenue estimate / mo
- $1.0M ($980.0K – $1.2M)AI medium
- AI annual estimate
- $12.0M/yr
- ML model estimate / mo
- $15.3K/mo
- Top-grossing rank
- 🇫🇷#21 /100 🇧🇷#27 /100 🇩🇪#32 /100 🇨🇦#41 /100 🇮🇳#41 /100 🇬🇧#46 /100 🇦🇺#76 /100
- All-time revenue
- Not found
- Pricing
- Not found
Founder
Funding
Press & Links
Contacts & Socials
📈Ratings growth29,124,643 ratings+18% lifetimeShow 3-year history estimate ▾
📝 About this app
— From Meta
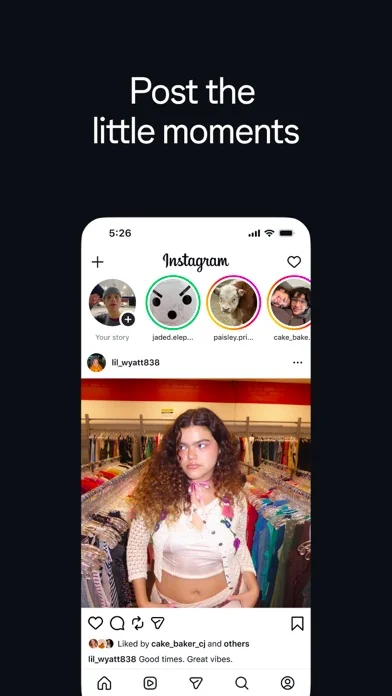
Connect with friends, find other fans, and see what people around you are up to and into. Explore your interests and post what's going on, from your daily moments to life's highlights.
Share what you’re up to and into:
- Turn your life into a movie and discover short, entertaining videos on Instagram with Reels.
- Keep up with friends on the fly with Stories and Notes that disappear after 24 hours.
- Start group chats and share unfiltered moments with your Close Friends.… View full description on the official store →
What Worked™ · Development Pipeline
8 EVENTS TRACKEDASO Keyword Positions
BEST RANK #6Tech & Domain Intel — instagram.com
- Tech stack
- Meta (Facebook) Ads · Google Workspace · Microsoft 365
Multi-Country Performance
Available in 9 of 9 monitored markets| Market | Rating | Reviews | Current version |
|---|---|---|---|
| 🇦🇺 AU | 4.68686★ | 1,963,683 | 4.68686★ this version |
| 🇧🇷 BR | 4.80938★ | 10,994,453 | 4.80938★ this version |
| 🇨🇦 CA | 4.64701★ | 2,649,864 | 4.64701★ this version |
| 🇩🇪 DE | 4.59075★ | 2,453,754 | 4.59075★ this version |
| 🇫🇷 FR | 4.64803★ | 3,327,869 | 4.64803★ this version |
| 🇬🇧 GB | 4.70123★ | 4,163,856 | 4.70123★ this version |
| 🇮🇳 IN | 4.66901★ | 7,587,012 | 4.66901★ this version |
| 🇯🇵 JP | 4.5495★ | 4,133,857 | 4.5495★ this version |
| 🇺🇸 US | 4.69064★ | 29,128,817 | 4.69064★ this version |
Track this app’s revenue
FREE📝 Description
95
More by Instagram, Inc.
View all →


Why high confidence: 29,124,643 ratings · no founder-verified revenue (model estimate only).